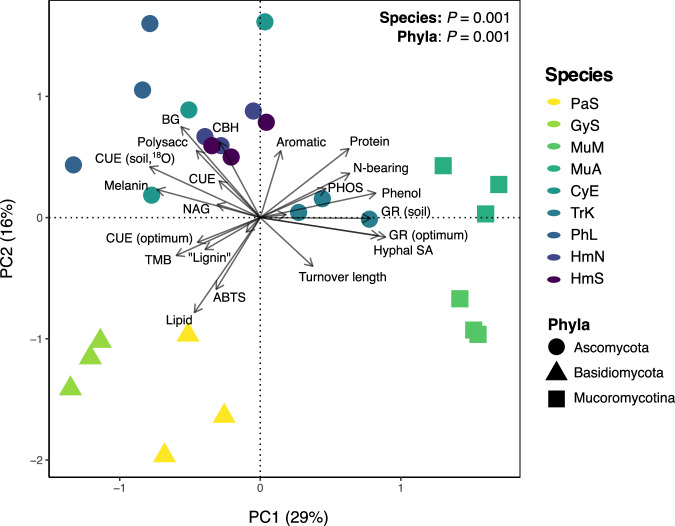
Fig. 2. Principal components analysis (PCA) of fungal trait profiles.
The two most explanatory PC axes are presented (PC1, PC2), which collectively explained 45% of variation in fungal trait data. The color of sample points represents fungal species (n = 3), while point shape represents fungal phyla. Vectors indicate individual trait measurements. The results of separate one-way MANOVA analyses for species and phyla are presented (both P = 0.001). Fungal species abbreviations are consistent throughout this manuscript and are as follows: HmS = H. minutispora (sporulating); HmN = H. minutispora (non-sporulating); PhL = P. lacerum; TrK = T. koningii; CyE = C. elongatum; MuA = M. abundans; MuM = M. mucedo; GyS = Gymnopus sp.; PaS = P. stipticus. Source data are provided as a supplementary Source Data file.

