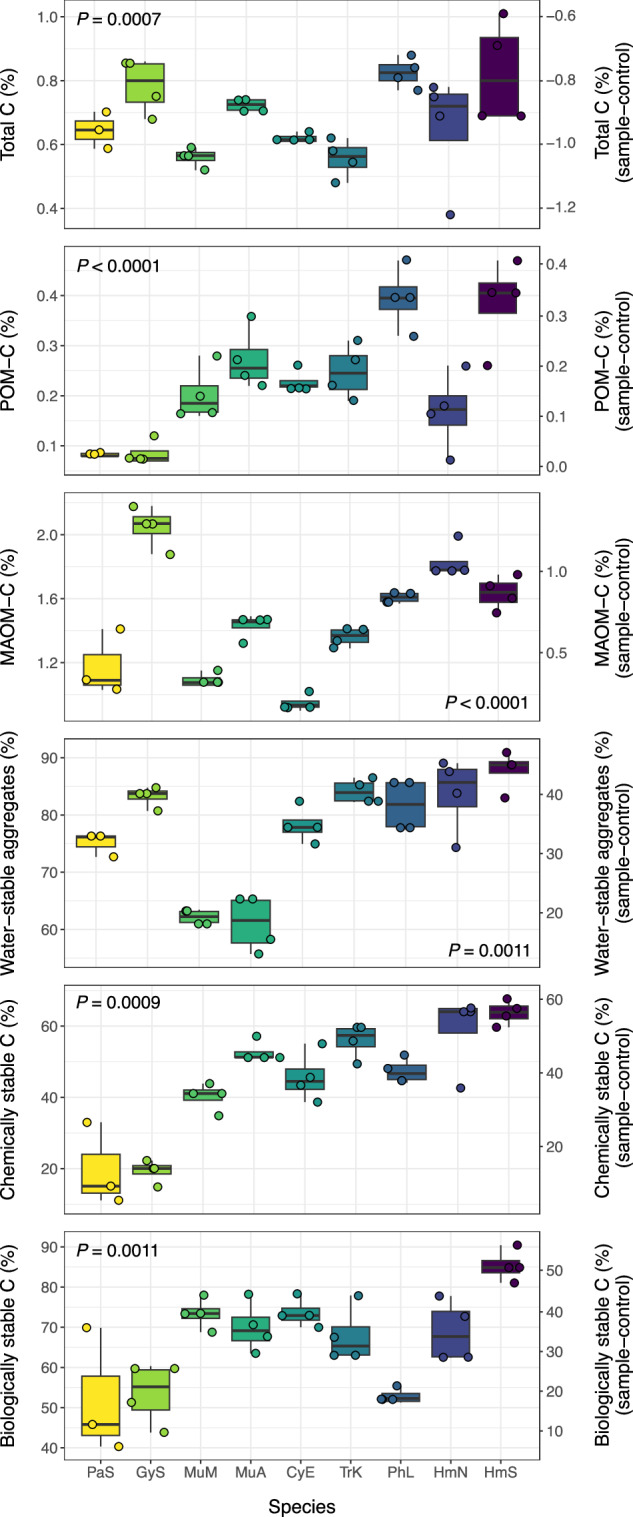
Fig. 3. Isolate contributions to SOM functional pools.

Contributions are presented as total uncorrected values (lefthand Y-axis) and corrected values (righthand Y-axis), which were calculated as the difference between inoculated (fungal) and sterile control samples (n = 4, except P. stipticus, n = 3). Corrected values for total C are negative, as the sterile control samples contained higher C concentrations than the inoculated samples, due to the absence of respiratory CO2 losses. Colors represent fungal species (carried throughout figures). Boxplots represent 25th and 75th percentile, median and outlying points. Whiskers extend from minimum to maximum values (no further than 1.5x the inter-quartile range). Results (p-values) of one-way ANOVA or Kruskal-Wallis tests are presented for each SOM functional pool (all P < 0.05). Source data are provided as a supplementary Source Data file.
