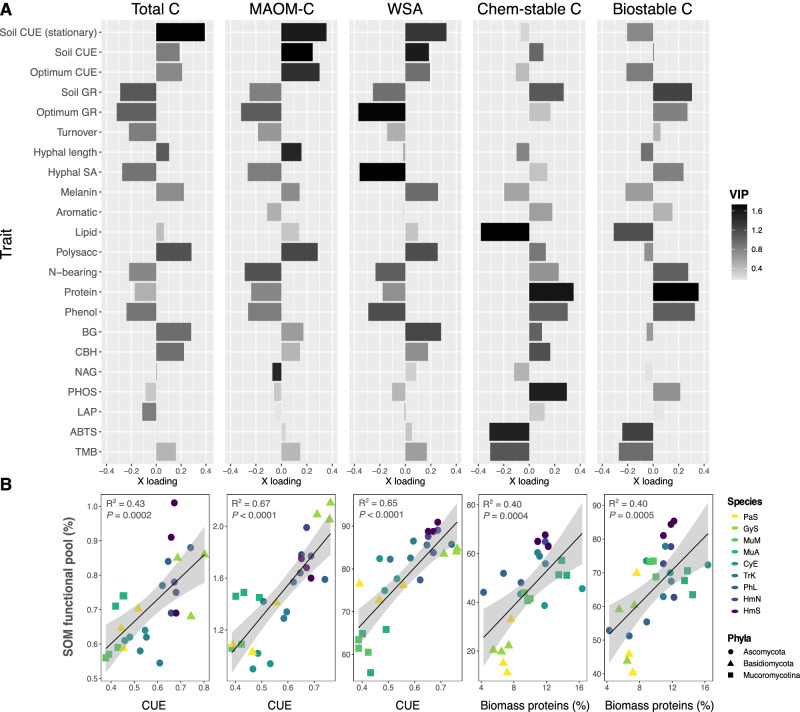
Fig. 4. Fungal traits predicting SOM pool formation.
A Bar plots of trait loadings on the first (most explanatory) PLSR latent factor for each SOM functional pool, accounting for 50–78% of variation in each pool. From left to right: total C, MAOM-C, water-stable aggregates (WSA), chemically stable C, and biologically stable C. Bar color is shaded to represent variable importance scores (VIP) for each trait variable (n = 3), indicating the overall importance of each trait to the PLSR model, integrating latent factor 2, and in some cases, factor 3. Full PLSR model results are reported in Supplementary Table 3a, b, and a version of this plot with POM included is presented in Supplementary Fig. 6. Optimum growth rate and CUE were measured in liquid culture. All growth rate and CUE assays were conducted during log-phase, unless specified at stationary growth. B Linear regressions (n = 27) between the trait variable with the strongest loading on PLSR1 for each SOM functional pool, where regression plots correspond with the functional pool whose PLSR results are presented directly above (i.e., the first panel represents the correlation between CUE and total C, and so on). For regressions involving CUE, an average CUE value was calculated across the three CUE metrics included in this study (liquid culture log-phase, soil log-phase, soil stationary growth). Biomass proteins represent the relative abundance of proteins in the biomass of fungal isolates grown in liquid culture, as quantified by Py-GC/MS. Point color represents fungal species, as in prior plots, with trait multifunctionality and SOM formation potential generally increasing from light to dark colors (Supplementary Fig. 2). Error bands represent 95% confidence interval. Source data are provided as a supplementary Source Data file.

