
Fig. 5. Linear regression between trait multifunctionality and SOM formation potential.
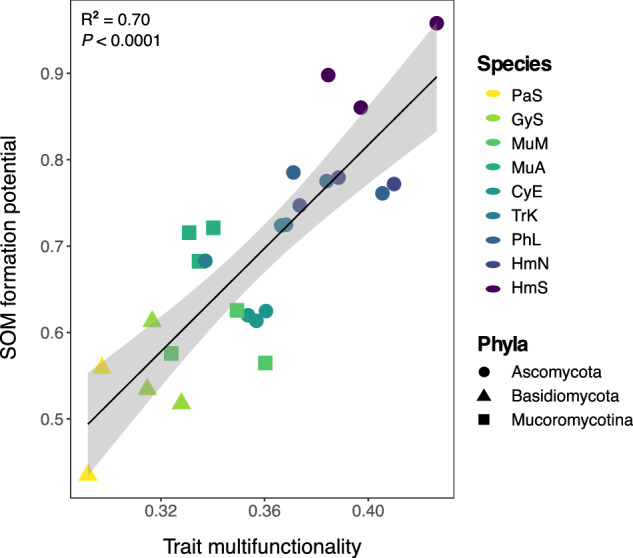
Point color represents fungal species, while point shape represents fungal phyla. The SOM pools included in the calculation of average SOM formation potential included: total C, POM, MAOM, water-stable aggregates, chemically stable C and biologically stable C. One PaS replicate with significantly lower trait multifunctionality ( ~ 0.2) is removed from the plot for ease of visualizing differences across other samples, but does not change the interpretation of the results (both P < 0.0001). One-way ANOVA results are presented for the model that included all replicates (n = 27; R2 = 0.70; P < 0.0001). Error bands represent 95% confidence interval. Source data are provided as a supplementary Source Data file.