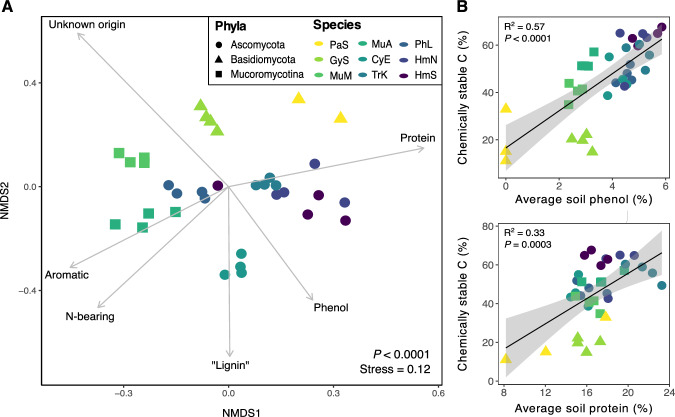
Fig. 6. Ordination of chemical composition and correlations between abundances of soil phenol and protein.
A NMDS ordination of SOM chemical composition (individual compound-level data) after long-term incubation with fungal isolates (n = 4, except P. stipticus, n = 3). Results for a single temperature fraction (503oC) from the ramped pyrolysis GC/MS analysis are presented here for simplicity (P < 0.0001; PERMANOVA). Significant variations in species’ SOM chemistries were observed for each thermal fraction (all P < 0.001; one-way PERMANOVA), and full results are shown in Supplementary Fig. 10. Point color represents fungal species, while point shape represents fungal phyla. Environmental vectors representing broad chemical compound classes were included in the plot if significant (P < 0.05). B Correlations between the relative abundances of phenols (top) or proteins (bottom) in soils at the end of the long-term incubations and the proportion of chemically stable C produced by each fungal species (n = 27). One-way ANOVA results are presented (both P < 0.001). Error bands represent 95% confidence interval. Source data are provided as a supplementary Source Data file.

