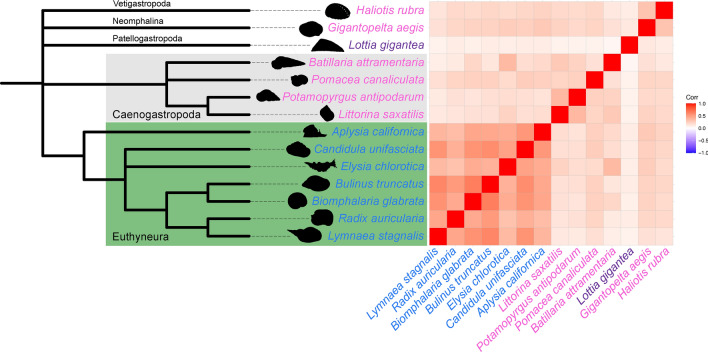
Fig. 3.
Gastropod proteome orthology. Left: phylogenetic relationships among 14 gastropod species (topology taken from141) used for gene orthology assessment (colour code: blue, simultaneous hermaphrodite; purple, sequential hermaphrodite: pink, separate sexed). Right: pairwise correlation of species contribution in terms of number of proteins to 29,428 orthogroups produced by OrthoFinder. Correlations are particularly strong within the set of euthyneuran species used in the analysis. The heat map gradient on the right indicates the level of (positive) correlation.

