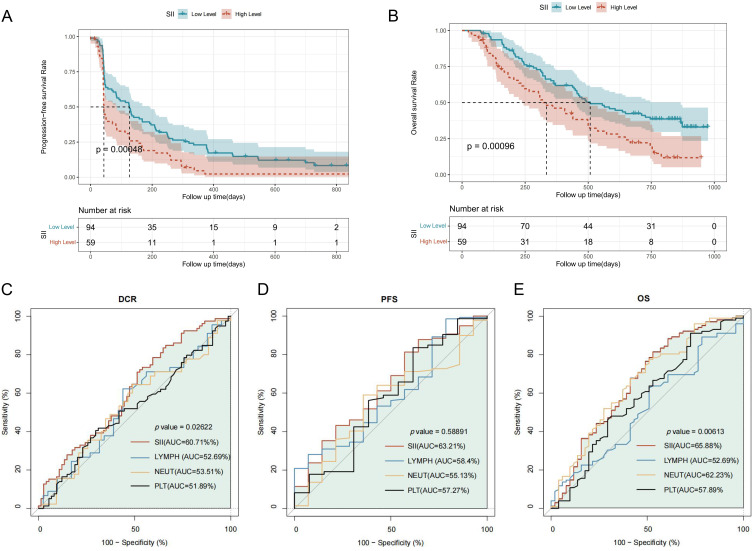
Figure 2.
Assessment of survival based on different SII status and ROC curves. (A) The Kaplan-Meier curves show the OS of patients with different SII statuses. (B) The Kaplan-Meier curves show the PFS of patients with different SII status. (C – E) The discrimination of SII in predicting the survival and efficacy of patients. The receiver operating characteristic curve (ROC) shows the predictive value of SII with comparison to its components.

