Fig. 2.
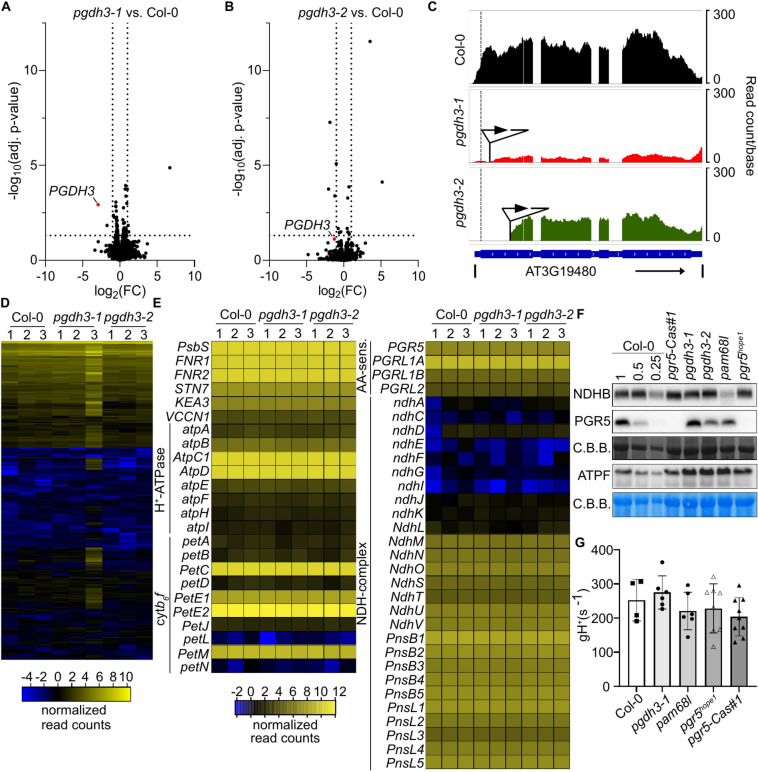
Transcriptomic and immunoblot analysis of mRNA and protein levels in WT and pgdh3 mutant plants. A-B Volcano plots of pgdh3-1 (A) or pgdh3-2 (B) vs Col-0 RNAseq experiments. Dotted lines depict a 0.05 adjusted p-value or log2 fold change (FC) of |1| cutoff, respectively. The red dot represents PGDH3 transcripts. C Read coverage of the PGDH3 (AT3G19480) locus of selected bio-replicates of WT (black), pgdh3-1 (red), or pgdh3-2 (green) after read mapping. The gene structure is given under the coverage plots in blue. The dashed line indicates the start codon of the gene while triangles show the location of the respective T-DNA insertions. D Heatmap showing normalized read counts of the 1000 most diverse genes (by standard deviation) of all three bio-replicates of WT, pgdh3-1, and pgdh3-2 plants. Rows are clustered hierarchically. E Non-clustered heat map of normalized read counts for selected genes which could influence ΔpH and NPQ, respectively, in Col-0, pgdh3-1, and pdgh3-2 plants. F Immunoblots (normalized to 15 µg total protein) of NDHB, PGR5, and ATPF with Coomassie brilliant blue staining of RbcL and Col-0 dilution (1; 0.5; 0.25 × total protein) as loading controls. G Thylakoid proton conductivity gH+(s-1) under standard growth conditions in 3-week-old plants. Col-0 (filled squares), pgdh3-1 (filled circle), pam68l (filled hexagon), pgr5hope1 (empty triangle), pgr5-Cas#1 (filled triangle) Mean, ± SD, N > 4.

