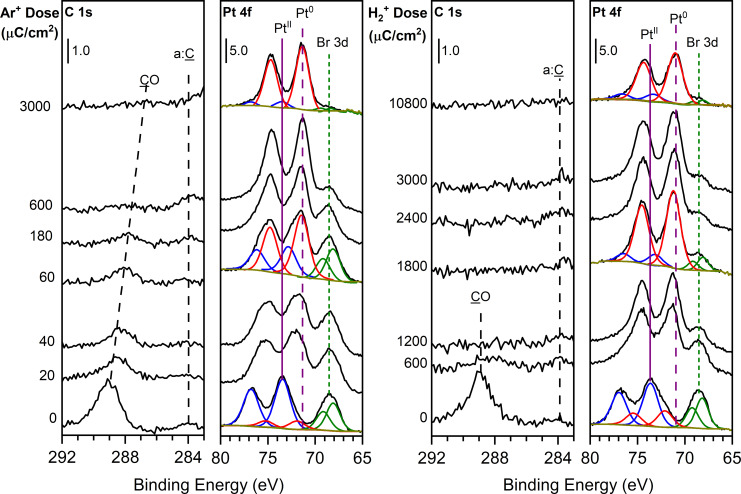
Figure 4.
Evolution of the C 1s and Pt 4f XP regions for a thin film of Pt(CO)2Br2 on a cooled (230 ± 5 K) tantalum oxide substrate exposed to (left) 3.0 keV Ar+ ions at a flux of 2.0 µA and (right) 3.0 keV H2+ ions at a flux of 2.0 µA. In the Pt 4f region, simulated peaks are shown for the Pt(II) (4f7/2/4f5/2) doublet in the parent precursor (blue), the Pt(0) doublet in the deposition product (red), and the Br 3d doublet (green). The purple solid and dashed lines indicate the binding energy of the Pt 4f7/2 peak in Pt(II) and Pt(0), respectively, and the green dotted line indicates the peak binding energy of the Br (3d5/2/3d3/2) peaks.

