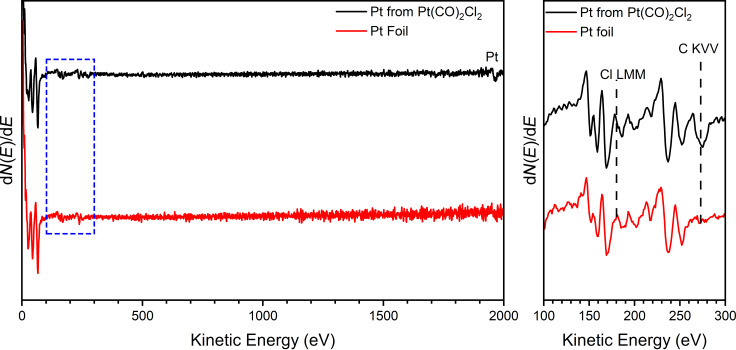
Figure 6.
(Left) AES survey spectra collected at 5 keV for Pt foil (red trace) and a deposit from Pt(CO)2Cl2 produced under steady-state conditions (black trace); full details are provided in the Experimental section. (Right) Detailed spectrum in the low-energy region. The dashed lines denote the kinetic energy positions of Cl LMM and C KVV Auger transitions.

