Figure 2.

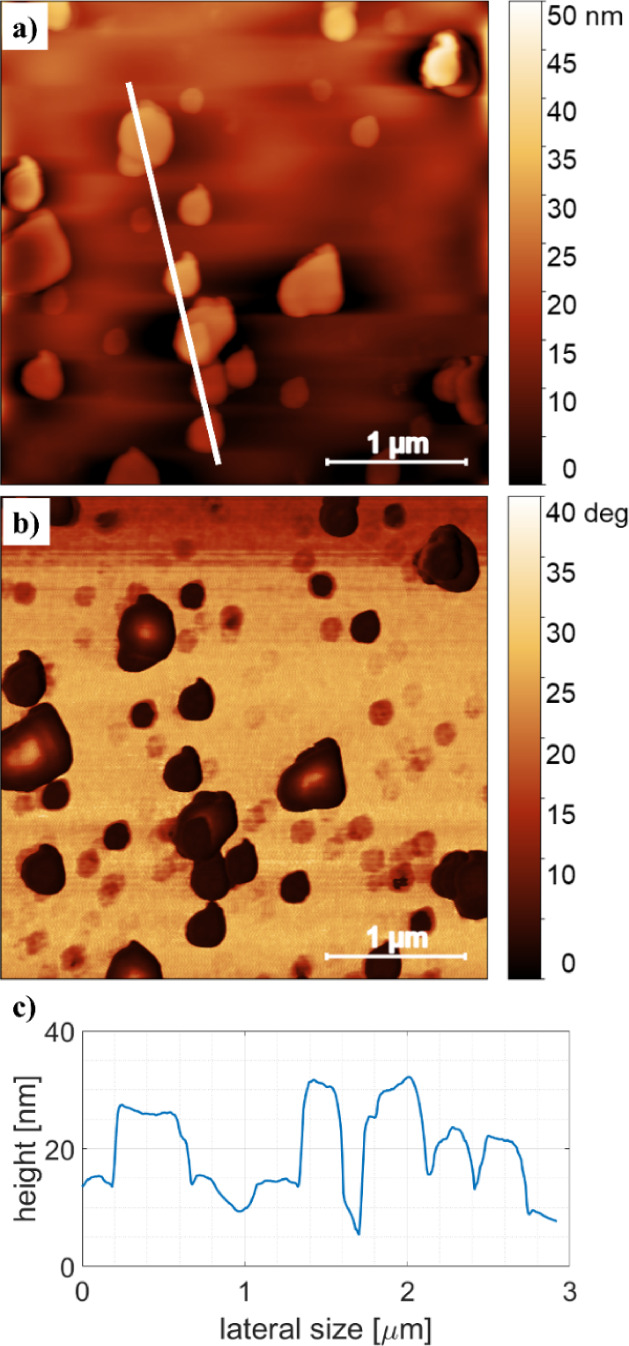
Detailed AFM image of the 1-cycle sample: a) a height image, b) the respective phase image, and c) a line scan (along the white line).

Detailed AFM image of the 1-cycle sample: a) a height image, b) the respective phase image, and c) a line scan (along the white line).