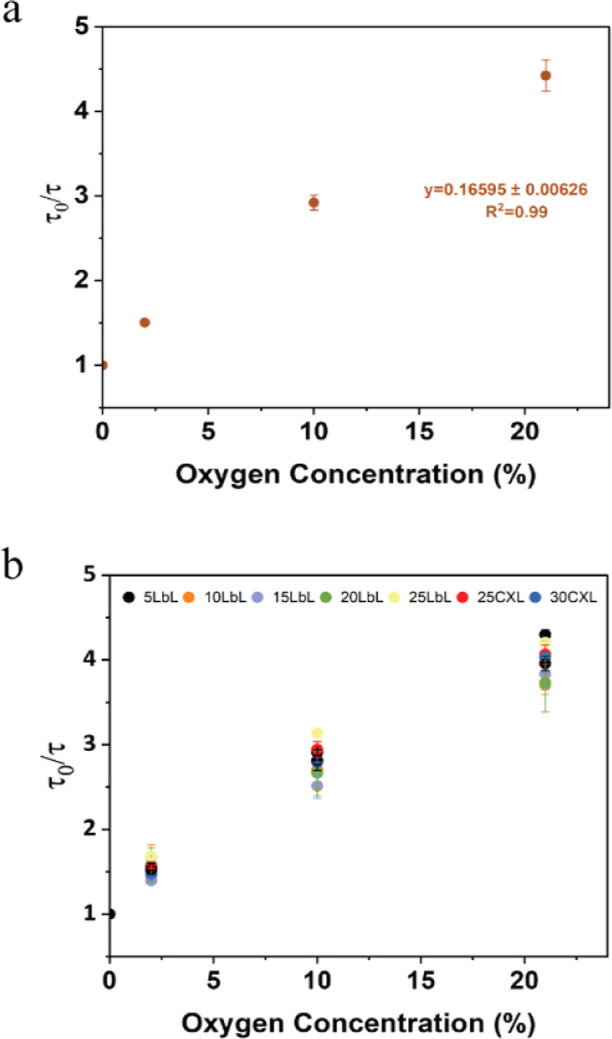
Figure 4.

Stern–Volmer plot for (a) oxygen barcode hydrogel sensor and (b) glucose barcodes packed with alginate microparticles bound by varying nanofilm coatings under different oxygen concentrations. Error bars represent the SD from the mean for N = 4 different samples.
