
Figure 5.
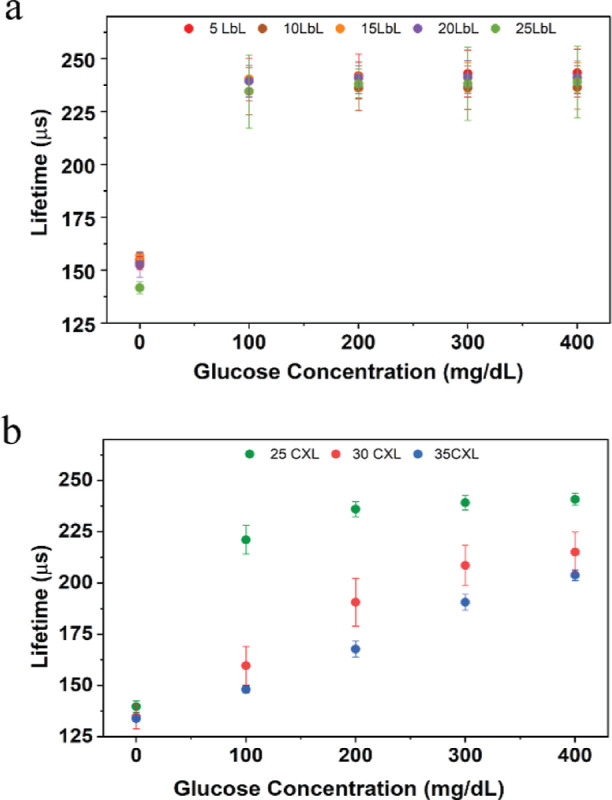
Steady-state lifetime response plots of glucose barcodes (n = 4) packed with alginate microparticles with different LbLs, dispersed in barcode hydrogel by challenging the sensors to the physiological glucose concentration (0–400 mg/dL) at 40 μM dissolved oxygen concentration and 37 °C. (a) Sensors consisted of non-cross-linked nanofilm coatings. (b) Sensors consisted of glutaraldehyde cross-linked (CXL) nanofilm coatings. Error bars represent the SD from the mean for N = 4 different samples.