6.

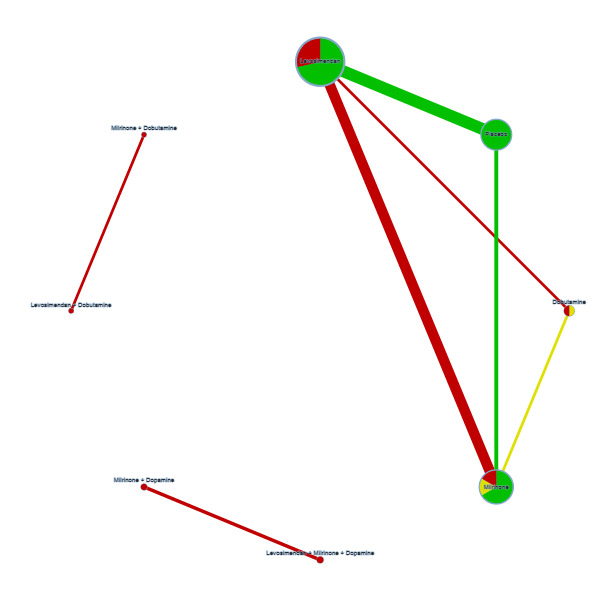
Networks for outcome 'Duration of mechanical ventilation'.
Key Colours represent risk of bias (green = low risk, yellow = unclear risk, red = high risk). The size of the nodes represents the number of participants who received a certain treatment. Line thicknesses represent the sample size, while line colours represent the highest risk of bias among the relevant studies. There are three networks, one with levosimendan/placebo/milrinone/dobutamine, one with milrinone + dobutamine versus levosimendan + dobutamine, and one with levosimendan + milrinone + dopamine versus milrinone + dopamine.
