Abstract
Background
Renal hypoxia and ischemia significantly contribute to chronic kidney disease (CKD) progression, underscoring the need for noninvasive quantitative assessments. This study employs blood oxygenation level-dependent magnetic resonance imaging (BOLD-MRI) and arterial spin labeling (ASL) MRI to comprehensively evaluate renal oxygenation and blood flow in CKD patients.
Methods
Forty-two CKD patients across stages 1–5 and ten healthy volunteers underwent simultaneous BOLD-MRI and ASL-MRI. We measured oxygenation (T2* values) and renal blood flow (RBF) in both the renal cortex and medulla, assessing their correlations with estimated glomerular filtration rate (eGFR) and other renal function indicators.
Results
BOLD and ASL revealed higher oxygenation and RBF in the renal cortex than in the medulla. Across CKD stages 2–5, both cortical and medullary oxygenation levels, as well as RBF, were lower than those in the control group and progressively decreased with CKD advancement. Additionally, renal oxygenation and blood flow levels positively correlated with serum creatinine (SCr), cystatin C (Cys C), and blood urea nitrogen (BUN), and negatively correlated with estimated glomerular filtration rate (eGFR) (p < 0.001). However, no significant correlation was observed with uric acid (UA) (p > 0.05). Notably, patients with CKD stages 1–3 exhibited strong correlations between renal oxygenation levels, RBF, and eGFR, while those with CKD stages 4–5 displayed weak correlations.
Conclusion
BOLD-MRI and ASL-MRI effectively measure renal oxygenation and perfusion noninvasively, confirming their utility in tracking CKD progression. These modalities provide accurate assessments of renal function and hypoxic-ischemic injuries across CKD stages, particularly in the early stages.
Keywords: Chronic kidney disease, renal oxygenation, renal blood flow, blood oxygenation level-dependent, arterial spin labeling, functional magnetic resonance imaging
1. Introduction
Chronic kidney disease (CKD), as a high-morbidity clinical disease, has increasingly become a critical public health issue worldwide [1]. In the progression of CKD to end-stage renal disease, altered renal hemodynamics lead to reduced peritubular blood perfusion and loss of peripheral capillaries, consequently decreasing renal blood flow (RBF) and oxygen delivery [2]. Hypoxia is recognized as a significant factor that promotes the progression of CKD and renal fibrosis [3,4]. In physiological states, the kidneys exhibit a countercurrent exchange mechanism between the renal arteries and veins, maintaining low renal oxygenation levels [5]. As RBF decreases in renal insufficiency, the kidneys rapidly enter a state of hypoxia. Additionally, conditions, such as proteinuria, anemia, and other pathological developments during CKD progression can exacerbate renal hypoxia [6]. Therefore, renal oxygenation level and RBF serve as independent predictors of renal injury and should be assessed using validated assays to evaluate CKD effectively.
Recent advances in functional magnetic resonance imaging (fMRI) have transformed renal imaging from purely morphological assessments to evaluations of functional characteristics, including renal perfusion, diffusion, and oxygenation [7]. Blood oxygenation level-dependent magnetic resonance imaging (BOLD-MRI) leverages the tissue intrinsic magnetic resonance parameter, effective transverse relaxation time (T2*), to respond to the deoxyhemoglobin concentration in tissues, and is considered the definitive noninvasive method for assessing renal oxygenation status [8]. In CKD patients, lower T2* values in BOLD-MRI indicate higher concentrations of deoxyhemoglobin, signaling more severe renal hypoxia [9]. Arterial Spin Labeling magnetic resonance imaging (ASL-MRI) is also extensively used to assess renal perfusion in patients with CKD, renal occupancy, and arterial stenosis, sharing the same noninvasive and convenient advantages as BOLD-MRI [10]. In this study, both BOLD-MRI and ASL-MRI were utilized to prospectively observe renal oxygenation and RBF in CKD patients, aiming to investigate the relationship between renal oxygenation and RBF across various degrees of renal injury.
2. Materials and methods
2.1. Participants selection
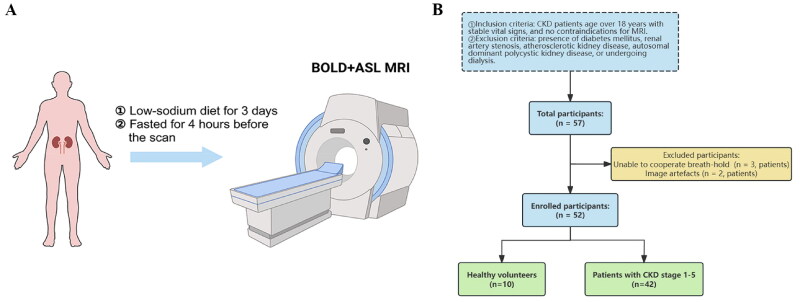
The study was conducted in accordance with the Declaration of Helsinki and written informed consent was obtained from all participants before enrollment. The study was approved by the Ethics Committee of Shuguang Hospital Affiliated to Shanghai University of Traditional Chinese Medicine (Identification number: 2019-705-37-01). The study initially recruited 10 healthy volunteers (HVs) and 47 patients with CKD stages 1–5 from July 2019 to July 2022 in Shuguang Hospital Affiliated to Shanghai University of Traditional Chinese Medicine. HVs had no history of kidney disease, hypertension, or diabetes with normal serum creatinine levels, no proteinuria, and an eGFR ≥ 90 mL/min/1.73 m2. Inclusion criteria for the CKD patients included: (1) age over 18 years and a CKD diagnosis according to the Kidney Disease: Improving Global Outcomes (KDIGO) standards [11], (2) with stable vital signs, and no contraindications for MRI, (3) received both BOLD-MRI and ASL-MRI on the same day at our facility. Exclusion criteria included: (1) presence of diabetes mellitus, renal artery stenosis, atherosclerotic kidney disease, autosomal dominant polycystic kidney disease, or undergoing dialysis; (2) poor image quality that precluded reliable analysis. All participants received training to hold their breath before MRI scanning, and also instructed to maintain a low-sodium diet for three days and fast for 4 h before the MRI, as shown in Figure 1(A). All participants successfully completed MRI scanning.
Figure 1.
(A) Schematic diagram of the BOLD-MRI and ASL-MRI in participants. (B) Flowchart for the study protocol. BOLD-MRI: blood oxygen level-dependent magnetic resonance imaging; ASL-MRI: arterial spin labeling magnetic resonance imaging.
Of the initial participants, 42 patients and 10 HVs were included in this study, details of those excluded are presented in Figure 1(B). Patients were classified into five groups (CKD stages 1–5) according to their eGFR stages as defined by KDIGO [11], using the CKD Epidemiology Collaboration (CKD-EPI) equation for calculation. HVs served as a control group.
2.2. MRI of renal oxygenation and perfusion
Both BOLD and ASL imaging were performed using a 3T magnetic resonance scanner (MAGNETOM Skyra; Siemens Healthcare, Erlangen, Germany) equipped with an 18-channel body surface coil. The routine MRI protocols included a T2*-weighted half-Fourier acquisition single-shot turbo-spin-echo sequence in both axial and coronal views, and a 3D T1*-weighted Dixon volumetric interpolated breath-hold examination. For BOLD-MRI, imaging of each kidney was conducted using a coronal multi-echo gradient echo sequence. Scanning parameters: repetition time 232 ms, echo time 17.22 ms, slice thickness 3.5 mm, flip angle 60°, field of view 380 × 300 mm, and matrix 168 × 256. For ASL-MRI, imaging of each kidney was conducted using a 3D pseudocontinuous ASL (pCASL) sequence. Scanning parameters: repetition time 6000 ms, echo time 21.16 ms, slice thickness 7 mm, flip angle 60°, field of view 300 × 150 mm, and matrix 64 × 32.
2.3. Image analysis and data collection
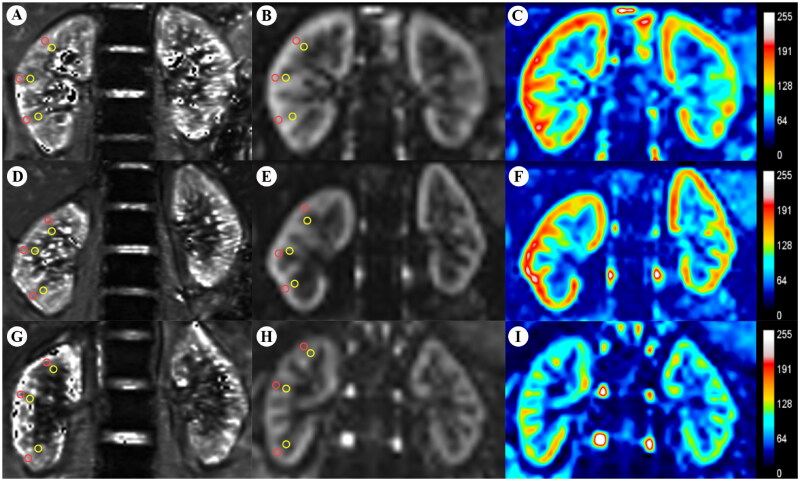
On both BOLD and ASL images of all participants, regions of interest (ROIs) were delineated on axial slices at the upper, middle, and lower poles of both the right and left kidneys by two experienced radiologists. Each kidney was assessed with 3 ROIs (each comprising 4–5 pixels), located in both the cortex and medulla. The ROIs were meticulously drawn to conform strictly to the boundaries of the cortex and medulla, ensuring the exclusion of renal sinuses, vessels, and susceptibility artifacts, as shown in Figure 2. Cortical and medullary T2* values (COT2* and MET2*), as well as RBF values, were measured in these ROIs and averaged between the two kidneys. Although the radiologists were aware of the participants’ CKD status, they were blinded to the clinical staging of CKD and other clinical variables of each patient. Additionally, clinical variables including age, serum creatinine (SCr), cystatin C (Cys C), blood urea nitrogen (BUN), uric acid (UA), 24-h urinary protein (24-h Upr), and estimated glomerular filtration rate (eGFR) were collected from all participants before MRI testing.
Figure 2.
BOLD-MRI T2* map (A,D,G) and ASL-MRI pCASL map (B,E,H) and false color map (C,F,I) in the coronal plane of the HVs and CKD patients. ROI-based technique, with placement of circled ROIs in the renal cortex (red) and medulla (yellow). (A–C) HV, 42-year-old woman. (D,E) Patient with CKD stage 2, 28-year-old man. (G–I) Patient with CKD stage 4, 57-year-old man. BOLD-MRI: blood oxygen level-dependent magnetic resonance imaging; ASL-MRI: arterial spin labeling magnetic resonance imaging; CKD: chronic kidney disease; HVs: healthy volunteers; ROI: region of interest.
2.4. Statistical analysis
Statistical analyses were conducted using SPSS 27.0 and GraphPad Prism 9.5. Two-sided p-values <0.05 were deemed statistically significant. The Shapiro–Wilk test was used to assess the normality of continuous variables. We calculated the mean and standard deviation for normally distributed variables and presented them as mean ± SD for both normal controls and patients grouped by CKD stage. Comparisons of these groups with the normal controls were made with independent Student’s t-test. The reproducibility of BOLD-MRI and ASL-MRI was evaluated using the intraclass correlation coefficient (ICC). We calculated Spearman or Pearson correlations to examine the associations between renal cortical and medullary oxygenation, RBF, and eGFR.
3. Results
3.1. Participants’ clinical characteristics
Table 1 presents the clinical characteristics of CKD patients and HVs recruited for the study. Among the CKD patients, 6 (14.29%) were in stage 1, 7 (16.67%) in stage 2, 15 (35.71%) in stage 3, 9 (21.43%) in stage 4, and 5 (11.90%) in stage 5. Of these, 29 had chronic glomerulonephritis, 5 had hypertensive nephropathy, 3 with other CKD causes, and 5 with CKD of unknown etiology. There were significant differences in the SCr, BUN, Cys C, UA, and eGFR values among HVs and CKD stages 2–5 groups (p < 0.05).
Table 1.
Results of clinical characteristics of HVs and CKD patients grouped by CKD stage.
| Characteristics | HVs (n = 10) | CKD 1 (n = 6) | CKD 2 (n = 7) | CKD 3 (n = 15) | CKD 4 (n = 9) | CKD 5 (n = 5) |
|---|---|---|---|---|---|---|
| Age, years | 42.70 ± 7.87 | 50.50 ± 10.13 | 44.86 ± 11.61 | 55.40 ± 11.89 | 54.44 ± 7.99 | 57.2 ± 9.83 |
| Sex, M/F, n | 5/5 | 2/4 | 4/3 | 9/6 | 5/4 | 3/2 |
| Cause of CKD, n (%) | ||||||
| Chronic glomerulonephritis | – | 6 (100.00) | 6 (85.71) | 10 (66.67) | 5 (55.56) | 2 (40.00) |
| Hypertensive nephropathy | – | – | – | 2 (13.33) | 3 (33.33) | – |
| Other | – | – | 1 (14.29) | – | – | 2 (40.00) |
| Unknown etiology | – | – | – | 3 (20.00) | 1 (11.11) | 1 (20.00) |
| Use of RAS inhibitors, n (%) | – | 3 (50.00) | 5 (71.43) | 8 (53.33) | 2 (22.22) | – |
| Use of SGLT2 inhibitors, n (%) | – | 2 (33.33) | 2 (28.57) | 5 (33.33) | – | – |
| 24-h Upr, g/day | – | 1.26 ± 0.37 | 1.77 ± 0.37 | 2.70 ± 1.33 | 2.97 ± 1.80 | 3.32 ± 2.69 |
| eGFR, mL/min/1.73 m2 | 107.56 ± 5.17 | 101.51 ± 6.09 | 69.23 ± 8.22*** | 47.24 ± 6.66*** | 22.01 ± 3.43*** | 11.24 ± 1.24*** |
| SCr, μmol/L | 60.80 ± 12.24 | 60.33 ± 5.53 | 106.43 14.34*** | 140.12 ± 30.95*** | 257.02 ± 51.79*** | 381.80 ± 47.66*** |
| Cys C, mg/L | 0.69 ± 0.09 | 0.73 ± 0.03 | 1.08 ± 0.08*** | 1.78 ± 0.38*** | 2.78 ± 0.43*** | 3.69 ± 0.53*** |
| BUN, mmol/L | 5.39 ± 0.91 | 5.72 ± 0.79 | 7.30 ± 1.21** | 9.88 ± 3.16*** | 13.37 ± 1.87*** | 21.92 ± 5.19*** |
| UA, μmol/L | 329.27 ± 25.65 | 353.05 ± 74.32 | 389.57 ± 68.88* | 398.47 ± 74.76* | 400.11 ± 46.38** | 467.60 ± 75.29*** |
HVs: healthy volunteers; RAS: renin angiotensin; SGLT2: sodium-dependent glucose transporters 2; 24-h Upr: 24-h urinary protein; eGFR: estimated glomerular filtration rate; SCr: serum creatinine; Cys C: cystatin C; BUN: blood urea nitrogen; UA: uric acid.
Significance in comparisons of means with the normal controls: *p < 0.05, **p < 0.01, ***p < 0.001.
3.2. Data consistency analysis
We evaluated the interobserver variability of the classical ROI-based method in patients and the HVs. The reproducibility of COT2* values (ICC = 93.7% > 0.75), MET2* values (ICC = 91.2% > 0.75), cortical RBF values (ICC = 90.3% > 0.75), and medullary RBF values (ICC = 87.9% > 0.75) were high.
3.3. BOLD T2* findings
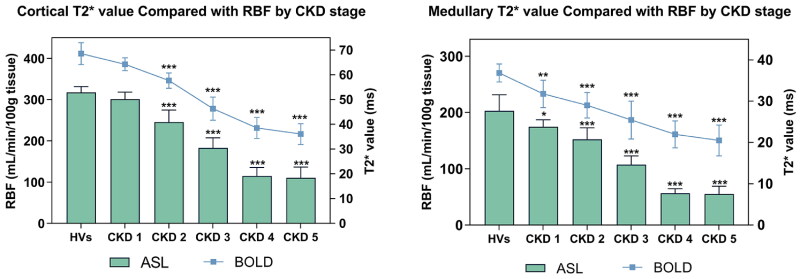
BOLD MRI with the application of tissue deoxyhemoglobin for measurement showed that COT2* values were significantly higher than MET2* values in all participants (p < 0.001). As CKD progressed, both COT2* and MET2* values decreased significantly, with measurements in patients with CKD stages 2, 3, 4, and 5 substantially lower than in HVs (p < 0.01). Even in the renal medulla, patients with CKD stage 1 (36.83 ± 2.17 ms) showed reduced mean T2* values compared to HVs (31.77 ± 3.11 ms) (p < 0.01), as shown in Table 2. However, despite decreasing renal oxygenation levels with worsening chronic renal failure, COT2* and MET2* values did not differentiate between CKD stages 4 and 5, recording COT2* values of 38.52 ± 4.26 and 36.08 ± 4.23 ms, and MET2* values of 21.97 ± 3.26 and 20.48 ± 1.72 ms, respectively.
Table 2.
Results of ASL RBF and BOLD T2*in kidneys of HVs and CKD patients grouped by CKD stage.
| Participant groups (n = 42) | COT2* (ms) | MET2* (ms) | Cortical RBF (mL/min/100 g) | Medullary RBF (mL/min/100 g) |
|---|---|---|---|---|
| HVs (n = 10) | 68.57 ± 4.43 | 36.83 ± 2.17 | 317.59 ± 14.02 | 202.85 ± 28.50 |
| CKD 1 (n = 6) | 64.31 ± 2.58 | 31.77 ± 3.31** | 300.88 ± 17.30 | 174.42 ± 12.51* |
| CKD 2 (n = 7) | 57.69 ± 3.10*** | 29.02 ± 3.10*** | 245.36 ± 29.43*** | 152.26 ± 20.41** |
| CKD 3 (n = 15) | 46.34 ± 4.69*** | 25.43 ± 4.60*** | 182.66 ± 24. 35*** | 107. 29 ± 15.56*** |
| CKD 4 (n = 9) | 38.52 ± 4.26*** | 21.97 ± 3.26*** | 114.83 ± 20.58*** | 56.53 ± 7.89*** |
| CKD 5 (n = 5) | 36.08 ± 4.23*** | 20.48 ± 3.72*** | 110.53 ± 25.85*** | 55.13 ± 13.76*** |
HVs: healthy volunteers; COT2*: cortical T2*; MET2*: medullary T2*; RBF: renal blood flow.
Significance in comparisons of means with the normal controls: *p < 0.05, **p < 0.01, ***p < 0.001.
3.4. ASL RBF findings
ASL-measured RBF per 100 g of cortical tissue was significantly higher than that of medullary tissue in both kidneys of each participant (p < 0.001). Cortical RBF decreased significantly as eGFR worsened, from 317.59 ± 14.02 in HVs to 245.36 ± 29.43 mL/min/100 g in CKD stage 2, and further to 110.53 ± 25.85 mL/min/100 g in CKD stage 5. Similar to the BOLD measurement outcomes, ASL-measured renal medullary RBF showed a statistically significant reduction between the CKD stage 1 group and the HVs (p < 0.05), from 202.85 ± 28.50 in HVs to 174.42 ± 12.51 mL/min/100 g in CKD stage 1, and further to 55.13 ± 13.76 mL/min/100 g in CKD stage 5, as shown in Table 2. However, similar to the BOLD measurements, the RBF measurements of ASL were similar in CKD stages 4 and 5 and no distinction can be made between the two groups. Figure 3 presents a comparison of BOLD T2* values with ASL RBF across CKD stages.
Figure 3.
BOLD-MRI measured T2* value compared with ASL-MRI measured RBF value in kidneys of HVs and patients grouped by CKD stages into cortical and medullary. BOLD-MRI: blood oxygen level-dependent magnetic resonance imaging; ASL-MRI: arterial spin labeling magnetic resonance imaging; RBF: renal blood flow; CKD: chronic kidney disease; HVs: healthy volunteers.
3.5. Association of eGFR with BOLD T2* and ASL RBF
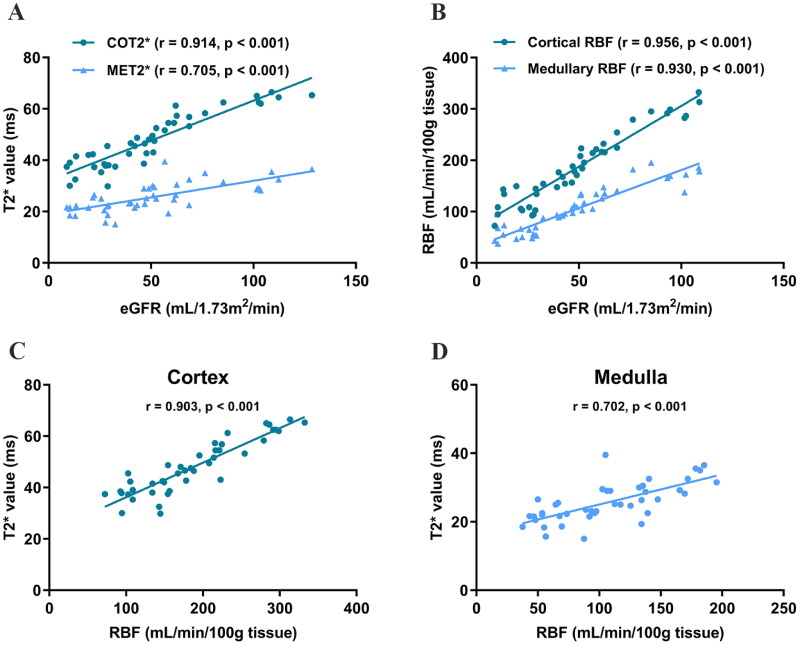
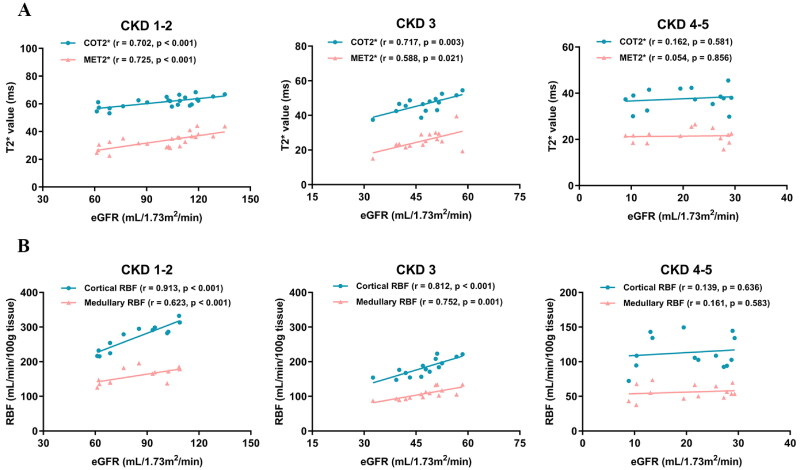
Correlation analysis revealed that BOLD T2* and ASL RBF assay values were well-correlated with eGFR. Further analysis confirmed a positive correlation between renal oxygenation and RBF levels, as shown in Figure 4. Moreover, we stratified patients into mild (CKD stages 1–2), moderate (CKD stage 3), and severe (CKD stages 4–5) groups to analyze the correlations of T2* and RBF values with eGFR separately. This stratification aimed to determine whether CKD patients at different stages exhibit varying sensitivities to renal hypoxia and ischemia, as shown in Figure 5. The findings indicated that both the mild and moderate groups showed a good correlation between renal oxygenation levels and RBF with eGFR, whereas the severe group displayed poor correlations.
Figure 4.
(A) Correlation of eGFR with T2* value. (B) Correlation of eGFR with RBF value. (C) Correlation of T2* value with RBF value in cortical. (D) Correlation of T2* value with RBF value in medullary. eGFR: estimated glomerular filtration rate; COT2*: cortical T2*; MET2*: medullary T2*; RBF: renal blood flow.
Figure 5.
(A) Correlation of eGFR and T2* value in CKD stages 1–2 group, CKD stage 3 group, and CKD stages 4–5 group. (B) Correlation of eGFR and RBF value in CKD stages 1–2 group, CKD stage 3 group, and CKD stages 4–5 group. eGFR: estimated glomerular filtration rate; CKD: chronic kidney disease; COT2*: cortical T2*; MET2*: medullary T2*; RBF: renal blood flow.
3.6. Association of clinical variables with BOLD T2* and ASL RBF
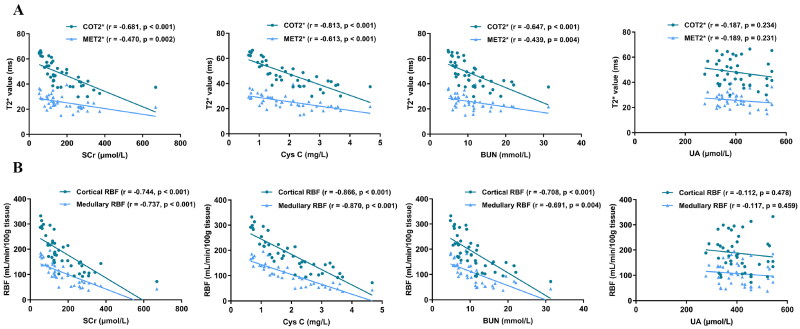
Figure 6 illustrates the Association of clinical variables with BOLD T2* and ASL RBF. BOLD T2* and ASL RBF values exhibited significant negative correlations with SCr, Cys C, and BUN in both cortex and medulla. Notably, the strongest correlations were observed between COT2* and Cys C (r = −0.813, p < 0.001), cortical RBF and Cys C (r = −0.866, p < 0.001), and medullary RBF and Cys C (r = −0.870, p < 0.001). No significant correlation was found between T2* and RBF and UA (p > 0.05).
Figure 6.
(A) Correlation of renal function indicators and T2* value in CKD patients. (B) Correlation of renal function indicators and RBF value in CKD patients. COT2*: cortical T2*; MET2*: medullary T2*; RBF: renal blood flow; SCr: serum creatinine; Cys C: cystatin C; BUN: blood urea nitrogen; UA: uric acid.
4. Discussion
The global burden of CKD continues to rise, yet current methods for its assessment and treatment remain limited [12]. The renal parenchyma consists of two parts: the cortex and the medulla. Basic research has shown that RBF constitutes 20–25% of total cardiac output, with over 90% directed to the renal cortex and substantially less to the medulla. Consequently, the renal cortex is characterized by high blood flow and oxygen content, while the renal medulla exhibits significantly lower levels of both [13]. Increasing evidence indicates that regardless of the initial renal pathology, hypoxic and ischemic conditions are common and interconnected in CKD, contributing to its progression [14]. Regrettably, traditional imaging methods, such as CT and ultrasound, while widely used in renal assessment, have demonstrated limited accuracy in evaluating renal oxygenation and perfusion [15].
Early studies evaluated renal oxygenation using the method of sodium transport efficiency ratio (QO2/TNa). However, this method is ex vivo and fails to reflect the real-time oxygenation status of renal tissue [16]. While Doppler ultrasound is commonly used to detect renal vasculature, it lacks precision in assessing non-stenotic hemodynamic changes [17]. Currently, fMRI is evolving rapidly in the field of renal diseases, providing essential technical support for detecting changes in renal tissue oxygenation and blood flow. In our previous studies, BOLD-MRI and ASL-MRI demonstrated robust performance in assessing renal oxygenation and blood flow in patients with CKD stages 1–4 [18,19]. Consequently, this study builds on single fMRI assessments and employs both BOLD-MRI for measuring renal oxygenation levels and ASL-MRI for RBF, expanding the scope to include CKD stage 5. Due to the reduced image clarity associated with generating perfusion images using ASL-MRI, our study employed the pCASL sequence, which offers a higher signal-to-noise ratio and enhanced image quality.
Our study observed that in both HVs and CKD patients, the oxygenation and RBF levels of the renal cortex were consistently higher than those of the medulla, aligning with the physiological mechanisms of the kidneys [20]. In comparison to HVs, CKD patients presented lower T2* and RBF values, with these metrics showing a progressive decline as CKD advanced, in line with the findings of Yang et al. [21]. These results suggest that the extent of renal hypoxia and ischemia correlates positively with the severity of renal function impairment in CKD. During the course of chronic renal failure, reduced blood perfusion decreases oxygen carrying capacity, leading to renal hypoxia. Additionally, as CKD progresses, factors, such as inflammation, oxidative stress, and autophagy further exacerbate the degree of hypoxia and ischemia in renal tissues [22,23]. Renal oxygenation models confirm that complex oxygen diffusion gradients and metabolic processes within the kidney lead to lower oxygen saturation in the medulla than in the cortex [24]. Furthermore, the unique ‘U-shaped’ structure of medullary blood vessels promotes oxygen diffusion shunting, which decreases oxygen supply. This results in a more hypoxic and ischemic medullary environment compared to the cortex. Even partial restoration of blood flow can lead to sustained and complete ischemia and hypoxia throughout most of the medullary region [25]. Our results also support this observation: Compared to HVs, patients with CKD stage 1 showed a statistically significant decline in medullary T2* and RBF values, with a trend that was not evident in the renal cortex. This highlights the renal medulla’s sensitivity to early-stage hypoxia and ischemia. In contrast, studies by Prasad et al. [26] and Wang et al. [27] detected no significant differences in medullary oxygenation levels between healthy individuals and CKD patients. This discrepancy may be due to the inclusion of patients with diabetic kidney disease, which impacts glucose metabolism and consequently affects renal oxygenation [28]. Therefore, our study excluded patients with diabetic kidney disease.
In this study, we observed that T2* and RBF values positively correlate with eGFR and negatively with renal function indicators, suggesting that the degree of renal hypoxia and ischemia is closely related to the severity of renal functional decompensation. Furthermore, T2* and RBF values also demonstrated strong mutual correlations, confirming the tight linkage between oxygenation and RBF levels. Given that nephron numbers are permanently reduced in CKD patients, many studies identify changes in RBF as a fundamental precursor to renal hypoxia [29]. In addition to the decline in RBF leading to decreased renal oxygenation levels, the mechanisms underlying hypoxia may also relate to the progression of renal fibrosis, which hampers oxygen distribution in the tubulointerstitial space [30]. Conversely, studies by Khatir et al. [31] suggest that during CKD progression, the kidneys develop their own energy compensation mechanisms, potentially leading to a disproportionate reduction in renal oxygenation levels and RBF. While their study only included patients with moderate to severe CKD (eGFR < 60 mL/min/1.73 m2), which may lead to variations in the results of correlation studies. Moreover, research indicates that Cys C has the best correlation with T2* and RBF values, outperforming traditional renal function indicators like SCr and BUN. In contrast, no significant correlation exists between UA levels and T2* and RBF values. This discrepancy may arise from some patients taking uric acid lowering medications. Second, although elevated UA has been associated with CKD in many studies, whether this is a cause or a consequence of declining renal function remains controversial. Some reports suggest an association between low UA levels and CKD. This opposing effect is hypothesized to occur because UA is a major antioxidant in human plasma and is associated with oxidative stress. Thus the relationship between uric acid levels and renal function remains controversial [32].
Secondly, to assess the correlation between eGFR and both renal oxygenation and RBF levels across different CKD stages, we compared three groups of patients: CKD stages 1–2, CKD stage 3, and CKD stages 4–5. The results indicated that correlations between renal oxygenation, RBF, and eGFR were stronger in the CKD stages 1–2 and CKD stage 3 groups but were weaker in the CKD stages 4–5 group. This may be due to the blurring of the boundaries between the renal cortex and medulla in advanced CKD stages, potentially introducing bias in the delineation of ROIs [33]. It is also notable that differences in T2* and RBF values between patients in CKD stages 4 and 5 were minimal, and we hypothesize that a compensatory mechanism may exist in severe renal insufficiency. As renal function declines, renal tubular sodium uptake and energy consumption decrease, which may lead to a less pronounced differentiation of oxygenation and RBF. The results of this study demonstrate the reliability of BOLD-MRI and ASL-MRI in assessing renal function in CKD, especially in patients with CKD stages 1–3.
Although our study leverages advanced noninvasive BOLD/ASL MRI testing, it has several limitations. This pilot study was small, involving only 42 patients with chronic kidney disease, and may not have had sufficient power to justify the conclusions. And not all of the patients had a defined CKD etiology, which could influence the results due to varied underlying etiologies. Second, despite prior reports on the reproducibility of ASL in measuring RBF [34], extrapolating total RBF from the blood flow rate per 100 grams of renal tissue may not be accurate due to individual differences in kidney size and volume [35]. Third, the effects of renin angiotensin (RAS) inhibitor, sodium-dependent glucose transporters 2 (SGLT2) inhibitor, and diuretic administration on oxygen metabolism and renal hemodynamics are complex; however, most CKD patients are on long-term RAS inhibitor or SGLT2 inhibitor therapy, and many of them also take loop diuretics. Corresponding studies have shown that RAS inhibitor and SGLT2 inhibitor, while having the effect of ameliorating renal hypoxia in CKD, also reduce local renal vascular blood flow [36,37]. In contrast, rebound renal cortical hypoxia may occur after the disappearance of the diuretic effect induced by the labeled diuretic furosemide [38]. These factors may interfere with the evaluation of oxygenation and RBF. Although all participants in this study had diuretics disabled and were on a low-sodium diet for three days before the MRI scan, standardization in subsequent studies is still needed. Finally, only three ROIs from each kidney were analyzed in this study. Thus, a larger sample size with more ROIs across different renal layers is essential to enhance the diagnostic reliability of BOLD and ASL MRI.
5. Conclusions
In conclusion, noninvasive fMRI techniques, such as BOLD-MRI and ASL-MRI are effective in predicting the progression of chronic renal failure and serve as reliable diagnostic tools for assessing renal oxygenation and RBF. Decreased renal oxygenation levels are likely linked to reduced tissue perfusion, exhibiting a strong positive correlation between them. However, larger longitudinal studies are required to fully optimize the clinical application.
Supplementary Material
Acknowledgments
Not applicable.
Funding Statement
This study was supported by the National Natural Science Foundation of China (81973770) and the Three Years Action Plan Project of Shanghai Accelerating Development of Traditional Chinese Medicine (ZY[2018-2020]-FWTX-7005).
Ethical approval
All experiments and methods were performed in accordance with relevant guidelines and regulations. This study protocol was reviewed and approved by the Ethics Committee of Shuguang Hospital Affiliated to Shanghai University of Traditional Chinese Medicine (2019-703-58-01). Informed consent was obtained from all individual participants included in the study.
Consent for publication
Not applicable.
Authors contributions
Research idea and study design: Chen Wang, Chaoyang Ye, and Xinyue Zhang; data curation and formal analysis: Xinyue Zhang, Jing Yang, and Yizeng Xu; original draft, review, and editing of the manuscript: Xinyue Zhang, Chen Wang, and Chaoyang Ye; visualization: Fang Lu; funding acquisition: Chen Wang and Chaoyang Ye. All authors have read and approved the final submission.
Disclosure statement
No potential conflict of interest was reported by the author(s).
Data availability statement
The datasets generated and/or analyzed during the current study are available from the corresponding author on reasonable request.
References
- 1.Kalantar-Zadeh K, Jafar TH, Nitsch D, et al. Chronic kidney disease. Lancet. 2021;398(10302):786–802. doi: 10.1016/S0140-6736(21)00519-5. [DOI] [PubMed] [Google Scholar]
- 2.Kida Y. Peritubular capillary rarefaction: an underappreciated regulator of CKD progression. Int J Mol Sci. 2020;21(21):8255. doi: 10.3390/ijms21218255. [DOI] [PMC free article] [PubMed] [Google Scholar]
- 3.Li X, Yang S, Yan M, et al. Interstitial HIF1A induces an estimated glomerular filtration rate decline through potentiating renal fibrosis in diabetic nephropathy. Life Sci. 2020;241:117109. doi: 10.1016/j.lfs.2019.117109. [DOI] [PubMed] [Google Scholar]
- 4.Naas S, Schiffer M, Schödel J.. Hypoxia and renal fibrosis. Am J Physiol Cell Physiol. 2023;325(4):C999–C1016. doi: 10.1152/ajpcell.00201.2023. [DOI] [PubMed] [Google Scholar]
- 5.Layton AT. Recent advances in renal hypoxia: insights from bench experiments and computer simulations. Am J Physiol Renal Physiol. 2016;311(1):F162–F165. doi: 10.1152/ajprenal.00228.2016. [DOI] [PMC free article] [PubMed] [Google Scholar]
- 6.Schödel J, Ratcliffe PJ.. Mechanisms of hypoxia signalling: new implications for nephrology. Nat Rev Nephrol. 2019;15(10):641–659. doi: 10.1038/s41581-019-0182-z. [DOI] [PubMed] [Google Scholar]
- 7.Copur S, Yavuz F, Sag AA, et al. Future of kidney imaging: functional magnetic resonance imaging and kidney disease progression. Eur J Clin Invest. 2022;52(5):e13765. doi: 10.1111/eci.13765. [DOI] [PubMed] [Google Scholar]
- 8.Chen F, Yan H, Yang F, et al. Evaluation of renal tissue oxygenation using blood oxygen level-dependent magnetic resonance imaging in chronic kidney disease. Kidney Blood Press Res. 2021;46(4):441–451. doi: 10.1159/000515709. [DOI] [PubMed] [Google Scholar]
- 9.Niendorf T, Seeliger E, Cantow K, et al. Probing renal blood volume with magnetic resonance imaging. Acta Physiol. 2020;228(4):e13435. doi: 10.1111/apha.13435. [DOI] [PubMed] [Google Scholar]
- 10.Kannenkeril D, Janka R, Bosch A, et al. Detection of changes in renal blood flow using arterial spin labeling MRI. Am J Nephrol. 2021;52(1):69–75. doi: 10.1159/000513665. [DOI] [PubMed] [Google Scholar]
- 11.Kidney Disease: Improving Global Outcomes (KDIGO) CKD Work Group . KDIGO 2024 clinical practice guideline for the evaluation and management of chronic kidney disease. Kidney Int. 2024;105(4S):S117–S314. doi: 10.1016/j.kint.2023.10.018. [DOI] [PubMed] [Google Scholar]
- 12.Obrador GT, Levin A.. CKD Hotspots: challenges and areas of opportunity. Semin Nephrol. 2019;39(3):308–314. doi: 10.1016/j.semnephrol.2019.02.009. [DOI] [PubMed] [Google Scholar]
- 13.Chowdhury AH, Cox EF, Francis ST, et al. A randomized, controlled, double-blind crossover study on the effects of 1-L infusions of 6% hydroxyethyl starch suspended in 0.9% saline (voluven) and a balanced solution (Plasma Volume Redibag) on blood volume, renal blood flow velocity, and renal cortical tissue perfusion in healthy volunteers. Ann Surg. 2014;259(5):881–887. doi: 10.1097/SLA.0000000000000324. [DOI] [PubMed] [Google Scholar]
- 14.Hirakawa Y, Tanaka T, Nangaku M.. Renal hypoxia in CKD; pathophysiology and detecting methods. Front Physiol. 2017;8:99. doi: 10.3389/fphys.2017.00099. [DOI] [PMC free article] [PubMed] [Google Scholar]
- 15.Brown RS, Sun MRM, Stillman IE, et al. The utility of magnetic resonance imaging for noninvasive evaluation of diabetic nephropathy. Nephrol Dial Transplant. 2020;35(6):970–978. doi: 10.1093/ndt/gfz066. [DOI] [PMC free article] [PubMed] [Google Scholar]
- 16.O’Neill J, Jasionek G, Drummond SE, et al. Renal cortical oxygen tension is decreased following exposure to long-term but not short-term intermittent hypoxia in the rat. Am J Physiol Renal Physiol. 2019;316(4):F635–F645. doi: 10.1152/ajprenal.00254.2018. [DOI] [PubMed] [Google Scholar]
- 17.Sarikaya S, Altas O, Ozgur MM, et al. Treatment of nutcracker syndrome with left renal vein transposition and endovascular stenting. Ann Vasc Surg. 2024;102:110–120. doi: 10.1016/j.avsg.2023.11.036. [DOI] [PubMed] [Google Scholar]
- 18.Xu Y, Yang J, Lu F, et al. Correlation of renal oxygenation with renal function in chronic kidney disease: a preliminary prospective study. Kidney Blood Press Res. 2023;48(1):175–185. doi: 10.1159/000529165. [DOI] [PubMed] [Google Scholar]
- 19.Lu F, Yang J, Yang S, et al. Use of three-dimensional arterial spin labeling to evaluate renal perfusion in patients with chronic kidney disease. J Magn Reson Imaging. 2021;54(4):1152–1163. doi: 10.1002/jmri.27609. [DOI] [PubMed] [Google Scholar]
- 20.Sugahara M, Tanaka T, Nangaku M.. Hypoxia-inducible factor and oxygen biology in the kidney. Kidney360. 2020;1(9):1021–1031. doi: 10.34067/KID.0001302020. [DOI] [PMC free article] [PubMed] [Google Scholar]
- 21.Yang J, Yang S, Xu Y, et al. Evaluation of renal oxygenation and hemodynamics in patients with chronic kidney disease by blood oxygenation level-dependent magnetic resonance imaging and intrarenal doppler ultrasonography. Nephron. 2021;145(6):653–663. doi: 10.1159/000516637. [DOI] [PubMed] [Google Scholar]
- 22.Guo H, Bechtel-Walz W.. The interplay of autophagy and oxidative stress in the kidney: what do we know? Nephron. 2023;147(10):627–642. doi: 10.1159/000531290. [DOI] [PubMed] [Google Scholar]
- 23.Nuhu F, Bhandari S.. Oxidative stress and cardiovascular complications in chronic kidney disease, the impact of anaemia. Pharmaceuticals. 2018;11(4):103. doi: 10.3390/ph11040103. [DOI] [PMC free article] [PubMed] [Google Scholar]
- 24.Lee CJ, Ngo JP, Kar S, et al. A pseudo-three-dimensional model for quantification of oxygen diffusion from preglomerular arteries to renal tissue and renal venous blood. Am J Physiol Renal Physiol. 2017;313(2):F237–F253. doi: 10.1152/ajprenal.00659.2016. [DOI] [PubMed] [Google Scholar]
- 25.Evans RG, Smith DW, Lee CJ, et al. What makes the kidney susceptible to hypoxia? Anat Rec. 2020;303(10):2544–2552. doi: 10.1002/ar.24260. [DOI] [PubMed] [Google Scholar]
- 26.Prasad PV, Thacker J, Li LP, et al. Multi-parametric evaluation of chronic kidney disease by MRI: a preliminary cross-sectional study. PLOS One. 2015;10(10):e0139661. doi: 10.1371/journal.pone.0139661. [DOI] [PMC free article] [PubMed] [Google Scholar]
- 27.Wang ZJ, Kumar R, Banerjee S, et al. Blood oxygen level-dependent (BOLD) MRI of diabetic nephropathy: preliminary experience. J Magn Reson Imaging. 2011;33(3):655–660. doi: 10.1002/jmri.22501. [DOI] [PMC free article] [PubMed] [Google Scholar]
- 28.Stiernman LJ, Grill F, Hahn A, et al. Dissociations between glucose metabolism and blood oxygenation in the human default mode network revealed by simultaneous PET-fMRI. Proc Natl Acad Sci USA. 2021;118(27):e2021913118. doi: 10.1073/pnas.2021913118. [DOI] [PMC free article] [PubMed] [Google Scholar]
- 29.Deshpande RS, Langham MC, Susztak K, Wehrli FW.. MRI-based quantification of whole-organ renal metabolic rate of oxygen. NMR Biomed. 2024;37(1):e5153. doi: 10.1002/nbm.5153. [DOI] [PMC free article] [PubMed] [Google Scholar]
- 30.Wu YS, Liang S, Li DY, et al. Cell cycle dysregulation and renal fibrosis. Front Cell Dev Biol. 2021;9:714320. doi: 10.3389/fcell.2021.714320. [DOI] [PMC free article] [PubMed] [Google Scholar]
- 31.Khatir DS, Pedersen M, Jespersen B, et al. Evaluation of renal blood flow and oxygenation in CKD using magnetic resonance imaging. Am J Kidney Dis. 2015;66(3):402–411. doi: 10.1053/j.ajkd.2014.11.022. [DOI] [PubMed] [Google Scholar]
- 32.Park JH, Jo YI, Lee JH.. Renal effects of uric acid: hyperuricemia and hypouricemia. Korean J Intern Med. 2020;35(6):1291–1304. doi: 10.3904/kjim.2020.410. [DOI] [PMC free article] [PubMed] [Google Scholar]
- 33.Sørensen SS, Gullaksen S, Vernstrøm L, et al. Evaluation of renal oxygenation by BOLD-MRI in high-risk patients with type 2 diabetes and matched controls. Nephrol Dial Transplant. 2023;38(3):691–699. doi: 10.1093/ndt/gfac186. [DOI] [PubMed] [Google Scholar]
- 34.Alhummiany BA, Shelley D, Saysell M, et al. Bias and precision in magnetic resonance imaging-based estimates of renal blood flow: assessment by triangulation. J Magn Reson Imaging. 2022;55(4):1241–1250. doi: 10.1002/jmri.27888. [DOI] [PubMed] [Google Scholar]
- 35.Hall ME, Rocco MV, Morgan TM, et al. Chronic diuretic therapy attenuates renal BOLD magnetic resonance response to an acute furosemide stimulus. J Cardiovasc Magn Reson. 2014;16(1):17. doi: 10.1186/1532-429X-16-17. [DOI] [PMC free article] [PubMed] [Google Scholar]
- 36.Wu J, Chu Y, Jiang Z, et al. Losartan protects against intermittent hypoxia-induced peritubular capillary loss by modulating the renal renin-angiotensin system and angiogenesis factors. Acta Biochim Biophys Sin. 2020;52(1):38–48. doi: 10.1093/abbs/gmz136. [DOI] [PubMed] [Google Scholar]
- 37.Vallon V, Verma S.. Effects of SGLT2 inhibitors on kidney and cardiovascular function. Annu Rev Physiol. 2021;83(1):503–528. doi: 10.1146/annurev-physiol-031620-095920. [DOI] [PMC free article] [PubMed] [Google Scholar]
- 38.Ow CPC, Okazaki N, Iguchi N, et al. Effects of furosemide, acetazolamide and amiloride on renal cortical and medullary tissue oxygenation in non-anaesthetised healthy sheep. Exp Physiol. 2024;109(5):766–778. doi: 10.1113/EP091479. [DOI] [PMC free article] [PubMed] [Google Scholar]
Associated Data
This section collects any data citations, data availability statements, or supplementary materials included in this article.
Supplementary Materials
Data Availability Statement
The datasets generated and/or analyzed during the current study are available from the corresponding author on reasonable request.


