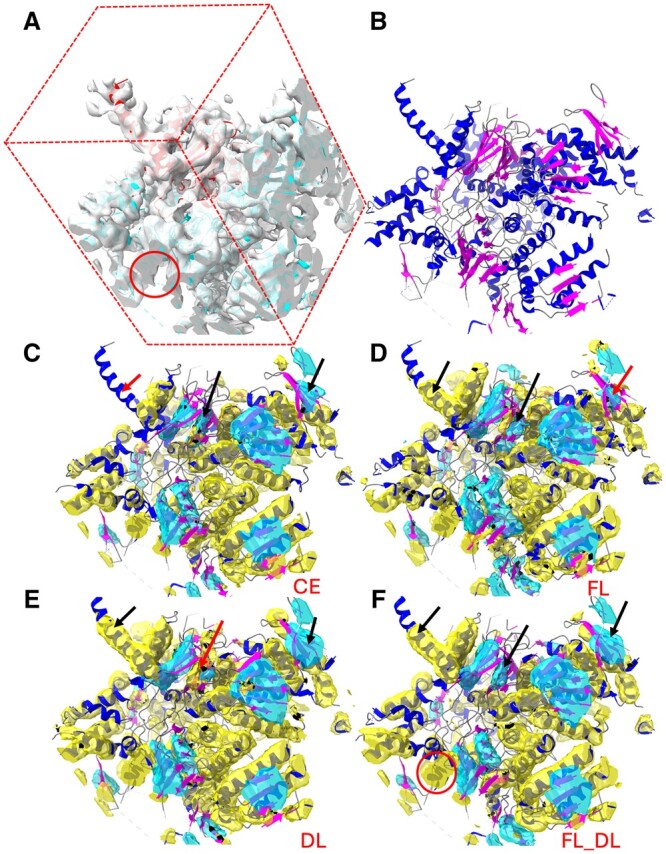
Figure 2.

Segmentation of secondary-structure elements using CNN models trained with the CE, FL, DL, and FL_DL loss functions, respectively. (A) Center box of a cryo-EM density map (EMD-4089, gray) near the atomic structure of chain D of PDB-5LN3 (ribbon with the center chain D in red). (B) Atomic structure of the cropped region, indicating the helices (blue ribbon), β-sheets (magenta ribbon), and the remaining molecular segments (gray). (C) to (F) show the helix regions (yellow) and the β-sheet regions (cyan) that were detected using CE, FL, DL, and FL_DL, respectively (helices: blue ribbon; β-sheets: magenta ribbon). The red arrows point to the undetected or wrongly detected regions, and the black arrows, for the better-detected corresponding regions. The red circle indicates a region at the edge of the box in (A) and the corresponding detected partial helix in (F).
