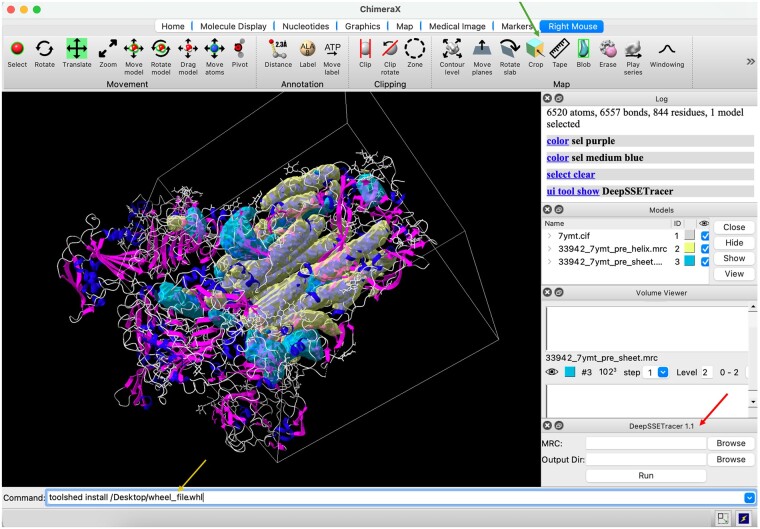
Figure 5.
DeepSSETracer 1.1 integrated into ChimeraX. The rectangular subregion (white box) of the cryo-EM density map EMD-33942 was cropped using the crop function (green arrow) of ChimeraX. The helix (transparent yellow) and the β-sheet (transparent cyan) regions that were detected using DeepSSETracer 1.1 are superimposed on the atomic structure of the entire PDB entry (ribbon). The atomic structure is shaded blue (helix), magenta (β-sheet), and gray (remaining molecular segments). The DeepSSETracer 1.1 panel (red arrow) and the installation command (yellow arrow) are indicated.

