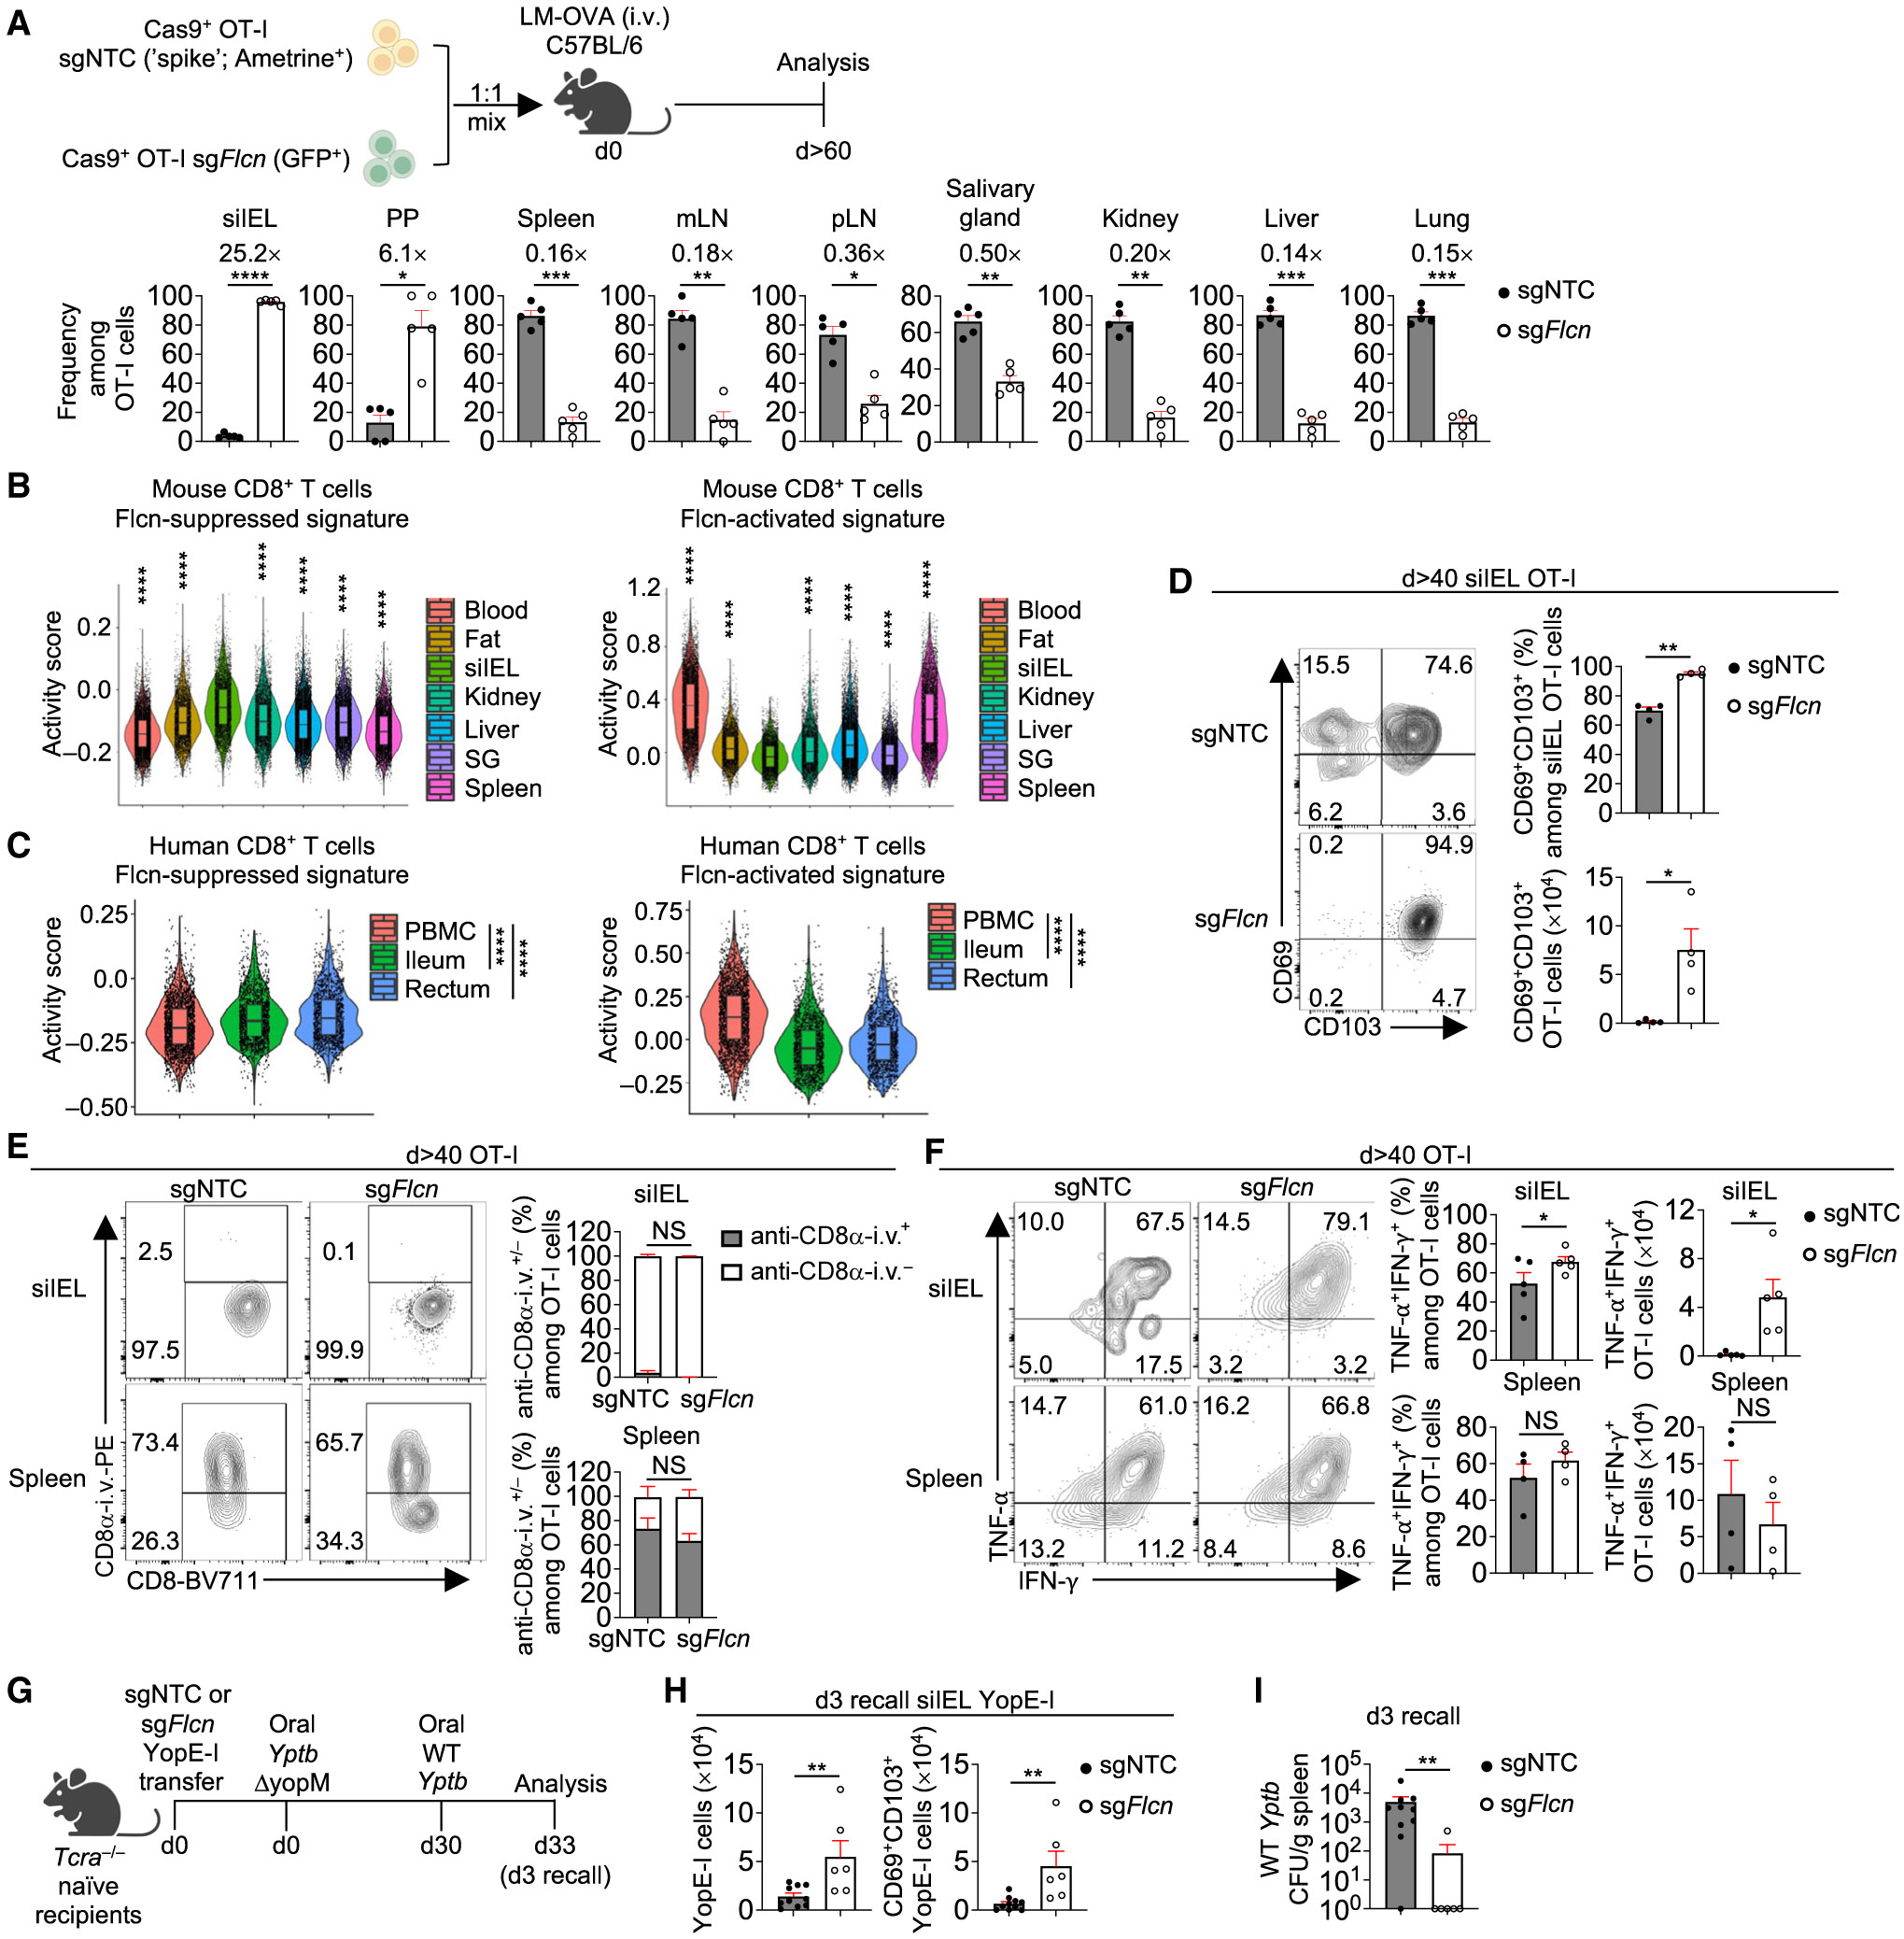
Figure 2. Targeting Flcn promotes functional TRM cell accumulation in small intestine.

(A) Frequencies among sgRNA-transduced OT-I cells in indicated tissues at day >60 p.i. (n = 5 per group). Fold-change relative to sgNTC is indicated.
(B and C) Violin plots showing activity scores of Flcn-suppressed and Flcn-activated signatures (see STAR Methods) in public scRNA-seq datasets of mouse27 (B) or healthy human28 (C) CD8+ T cells from indicated tissues. Asterisks indicate statistical significance in siIEL versus each tissue in (B). PBMCs, peripheral blood mononuclear cells; SG, salivary gland.
(D) Frequency and number of CD69+CD103+ OT-I cells transduced with indicated sgRNAs in siIEL at day >40 p.i. (n = 4 per group).
(E) Frequencies of CD8α-i.v.+ and CD8α-i.v.− among indicated sgRNA-transduced OT-I cells in siIEL or spleen at day >40 p.i. (n = 4 per group).
(F) Frequencies and numbers of TNF-α+IFN-γ+ OT-I cells transduced with indicated sgRNAs in siIEL or spleen at day >40 p.i. (n ≥ 4 per group).
(G–I) Schematic for Yptb recall response29 (G). Total or CD69+CD103+ YopE-I cells in siIEL (H) and bacterial burden in spleen (I) on day 3 after secondary infection (n ≥ 6 per group). Colony-forming units (CFUs). Two-tailed paired Student’s t test (A and D–F), two-tailed unpaired Student’s t test (H), two-tailed Mann-Whitney test (I), Wilcoxon rank sum test (B and C). NS, not significant; *p < 0.05, **p < 0.01, ***p < 0.001, ****p < 0.0001. Data (mean ± SEM) are compiled from ≥2 (A, H, and I) or represent ≥3 (D–F) experiments.
See also Figure S2.
