
Figure 5. Flcn limits TGF-β signaling to control TRM programming.
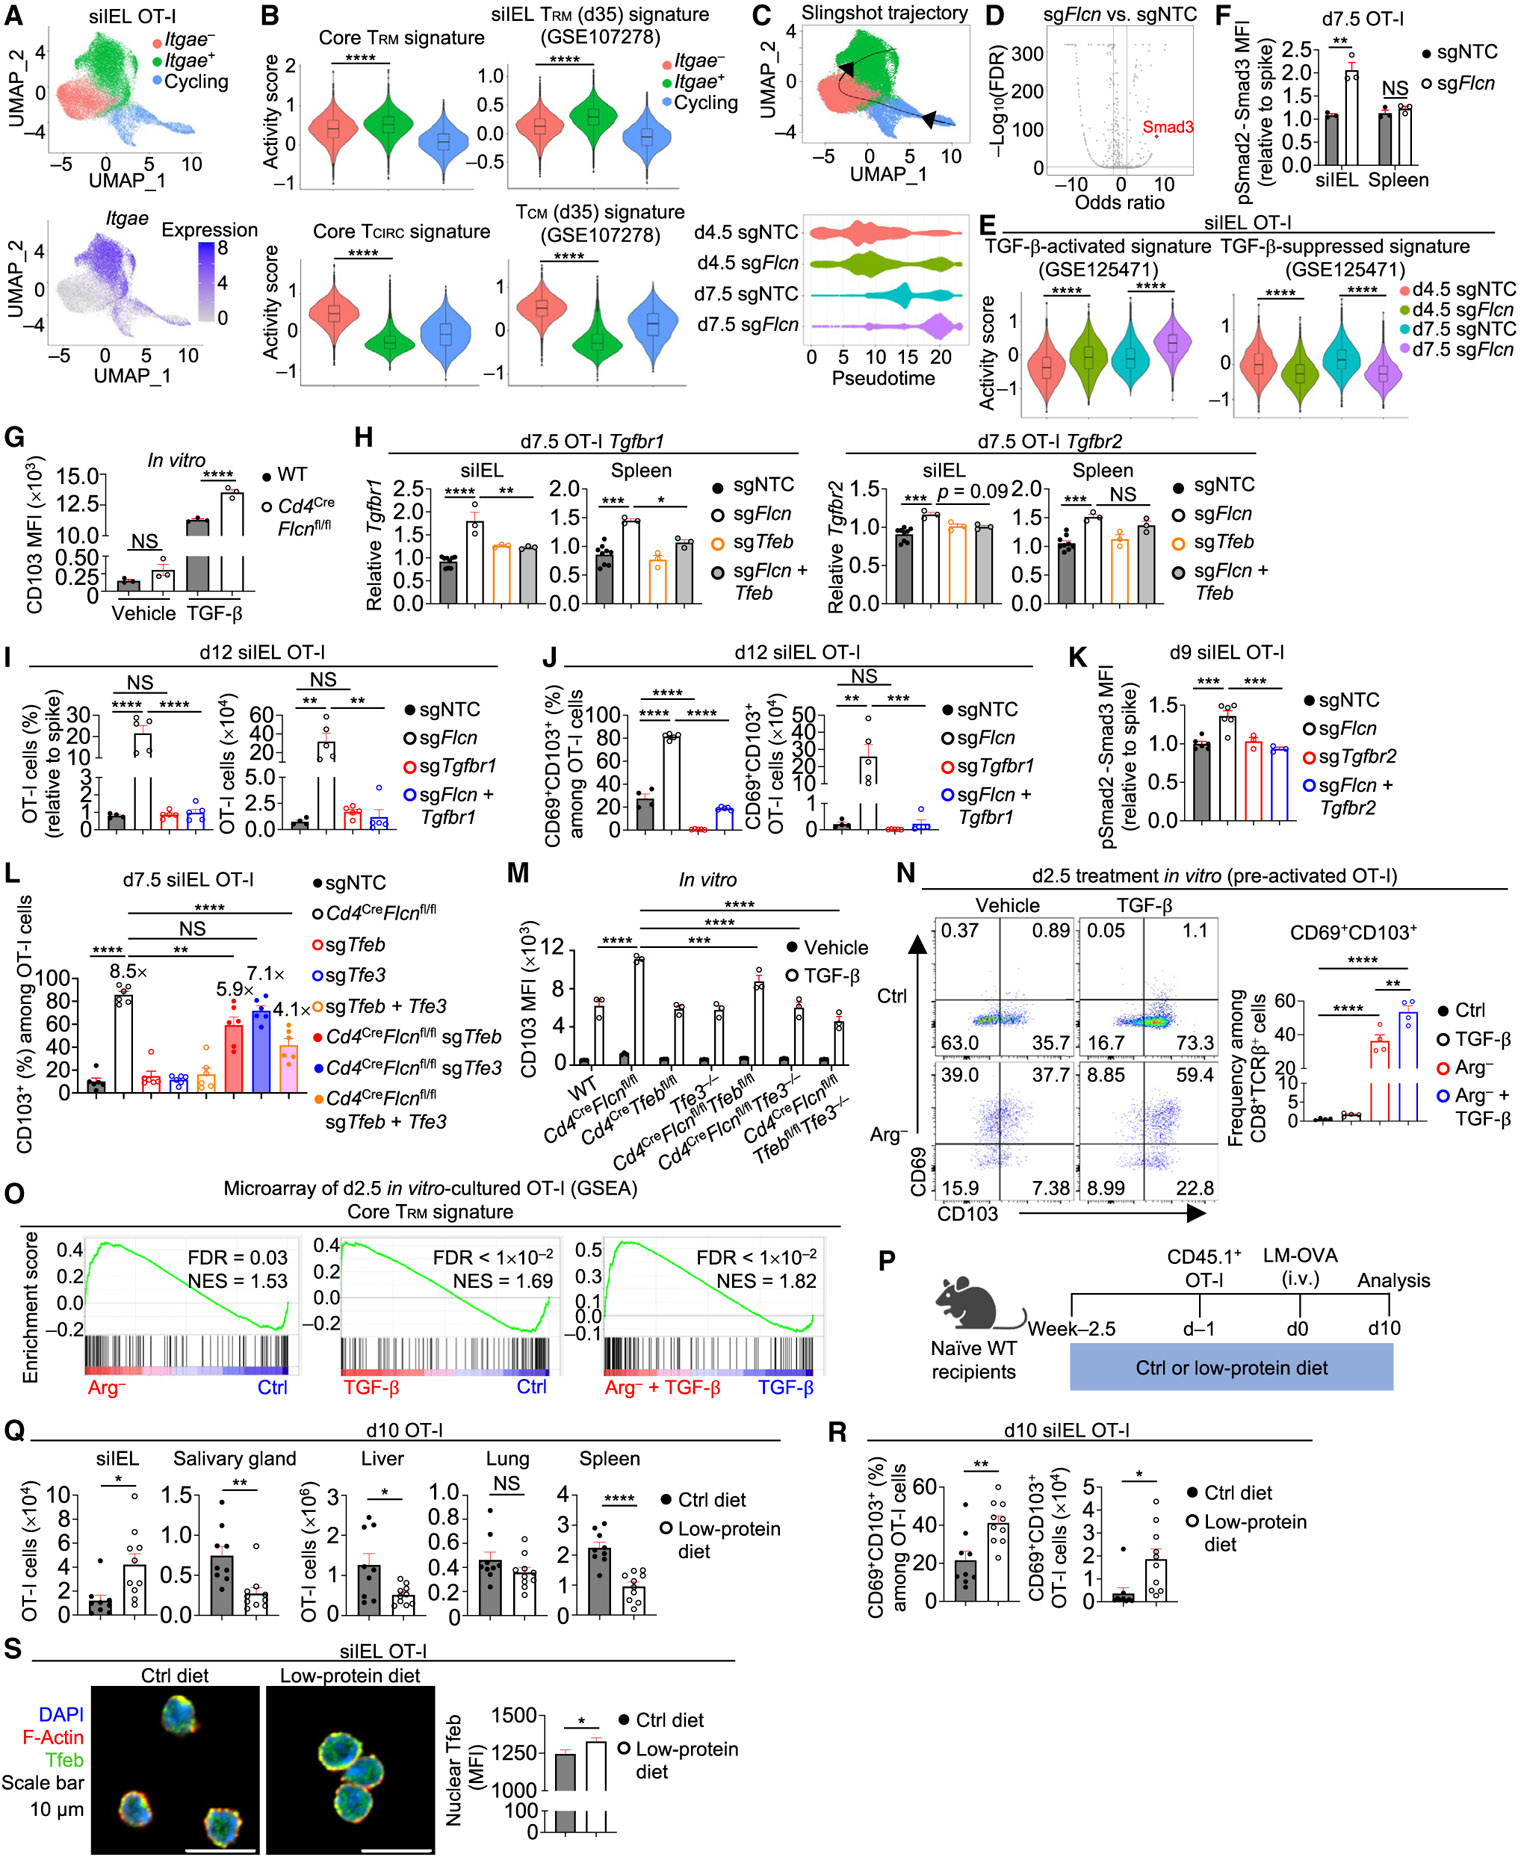
(A) sgNTC (Ametrine+)- and sgFlcn (GFP+)-transduced OT-I cells from siIEL of the same host were profiled by scRNA-seq at days 4.5 and 7.5 p.i. (n = 2 per group; pooled from 2 mice). UMAP plots depicting three clusters (cycling, Itgae−, and Itgae+) and Itgae expression.
(B) Violin plots showing activity scores of core TRM signature,7 core TCIRC signature,7 curated siIEL TRM signature,7 and curated TCM signature7 (see STAR Methods) among indicated 3 clusters.
(C) UMAP plot showing Slingshot trajectory analysis52 and pseudotime plot of indicated sgRNA-transduced siIEL OT-I cells at days 4.5 and 7.5 p.i.
(D) Plot depicting transcription factor motif enrichment analysis (including Smad3) comparing sgFlcn- versus sgNTC-transduced siIEL OT-I cells that were profiled by ATAC-seq at day 7.5 p.i.
(E) Violin plots showing activity scores of TGF-β-activated and TGF-β-suppressed signatures53 (see STAR Methods) in indicated sgRNA-transduced siIEL OT-I cells from scRNA-seq profiling in (A).
(F) pSmad2-Smad3 levels (relative to spike; based on MFI) in indicated sgRNA-transduced OT-I cells from siIEL or spleen on day 7.5 p.i. (n = 3 per group).
(G) CD103 expression (based on MFI) on WT or Flcn-deficient (from Cd4CreFlcnfl/fl mice) CD8+ T cells cultured with rhTGF-β1 (or vehicle) for 5 days (see STAR Methods) (n = 3 technical replicates per group).
(H) Real-time PCR analysis of Tgfbr1 and Tgfbr2 expression in indicated sgRNA-transduced OT-I cells from siIEL or spleen at day 7.5 p.i. (n ≥ 3 per group).
(I and J) Frequencies (relative to spike) and numbers of total (I) or CD69+CD103+ siIEL OT-I cells (J) transduced with indicated sgRNAs at day 12 p.i. (from dual-color transfer system) (n ≥ 4 per group).
(K) pSmad2-Smad3 levels (relative to spike; based on MFI) in indicated sgRNA-transduced OT-I cells from siIEL at day 9 p.i. (from dual-color transfer system) (n ≥ 3 per group).
(L) WT (from Flcnfl/flCas9+ mice) or Flcn-deficient (from Cd4CreFlcnfl/flCas9+ mice) OT-I cells that were transduced or co-transduced with indicated sgRNAs. Frequency of CD103+ siIEL OT-I cells at day 7.5 p.i. is shown. Fold-change relative to sgNTC is indicated (n = 6 per group).
(M) CD103 expression (based on MFI) on CD8+ T cells cultured with rhTGF-β1 (or vehicle) for 5 days (see STAR Methods) (n = 3 technical replicates per group).
(N) Pre-activated OT-I cells were transferred into Ctrl RPMI medium or Arg− RPMI medium containing rhTGF-β1 (or vehicle) for 2.5 days (see STAR Methods). Frequency of CD69+CD103+ OT-I cells is shown (n = 4 technical replicates per group).
(O) GSEA enrichment plots showing the core TRM signature7 in cells cultured in Arg− versus Ctrl medium, cells cultured in Ctrl medium plus rhTGF-β1 versus Ctrl medium, or cells cultured in Arg− medium plus rhTGF-β1 versus Ctrl medium plus rhTGF-β1 (as in N).
(P–R) Schematic for LM-OVA infection in mice fed control or low-protein diet (P). OT-I cell numbers in indicated tissues (Q) or frequency and number of CD69+CD103+ siIEL OT-I cells (R) at day 10 p.i. (n = 9–10 per group).
(S) Nuclear Tfeb MFI in siIEL OT-I cells from mice fed indicated diets (n > 30 cells per group). Wilcoxon rank sum test (B and E), two-tailed unpaired Student’s t test (F and Q–S), one-way ANOVA (H–L and N), two-way ANOVA (G and M). NS, not significant; *p < 0.05, **p < 0.01, ***p < 0.001, ****p < 0.0001. Data (mean ± SEM) are compiled from two (K, L, Q, and R) or represent ≥2 (F), one (H–J and S), or three (G, M, and N) experiments.
See also Figure S5.