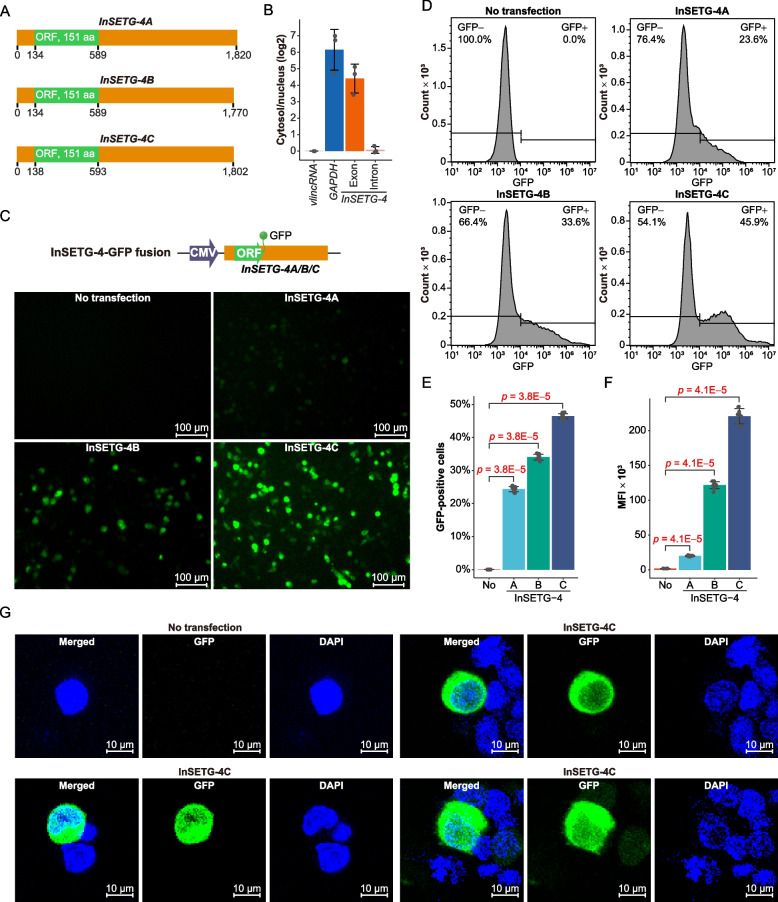
Fig. 4.
Confirmation of the protein-coding potential of InSETG-4 using GFP fusions. A Schematic diagram of the predicted major ORFs (green) and the untranslated regions (UTRs, orange) in the InSETG-4A/B/C transcripts. B The log2 of the cytosol/nucleus ratios of GAPDH mRNA and the spliced (“exon”) and primary (“intron”) InSETG-4 transcripts relative to the ratio of a nuclear-localized very long intergenic non-coding RNA (vlincRNA), ID-838, which is set as zero. C Expression of the ORF-GFP fusions of the InSETG-4 transcripts in 293FT cells. Scale bar, 100 μm. D Flow cytometry analysis of the 293FT cells transfected with the vectors containing ORF-GFP fusions of the InSETG-4 transcripts. For panels C and D, data from one representative biological replicate were shown. For results from all three biological replicates, see Additional file 2: Fig. S1. E, F Ratio of GFP-positive cells (E) and mean fluorescence intensity (MFI) (F) in the ORF-GFP transfected cells versus the untransfected control. Error bars in panels B, E, and F represent SD of three biological replicates. Statistical significance in panels E and F was determined using two-sided Wilcoxon rank sum test, with the p values indicated in the figure. G Confocal microscopy assay of the subcellular localization of the ORF-GFP fusion of InSETG-4C in 293FT cells. Scale bar, 10 μm

