Fig. 7.
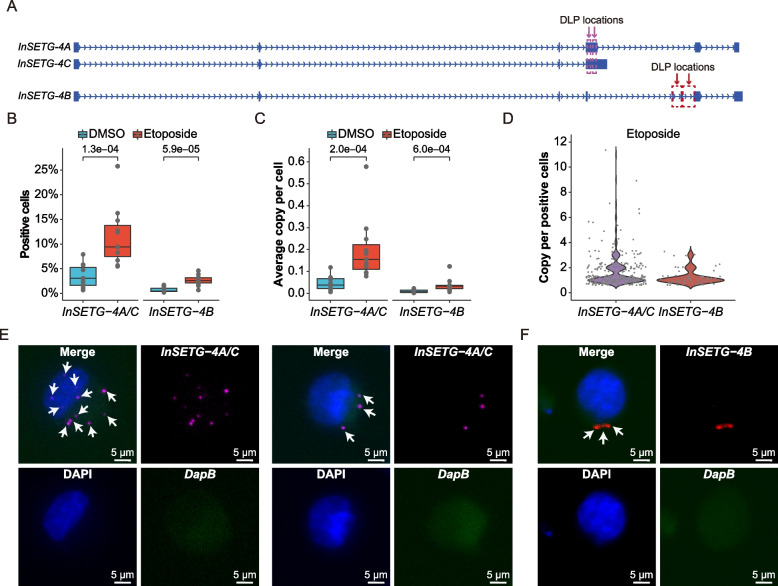
Single-cell analysis of the InSETG-4 expression using the asmFISH assay. A Schematic diagram of the locations of probes for the amplification-based single-molecule fluorescence in situ hybridization (asmFISH) assay. Two pairs of the DNA ligation probes (DLPs) for asmFISH were designed for InSETG-4A/C and InSETG-4B as indicated by the purple and red arrows, respectively. B–D Statistical analysis of the asmFISH assay results based on the ratio of InSETG-4 transcripts positive cells (B), average transcript copies per cell (C), and transcript copies per positive cell in etoposide-treated cells (D). In panels B and C, statistical significances were calculated using two-sided Wilcoxon rank sum test, with the p values indicated in the figures. E, F Microscopy images showing the expression of InSETG-4A/C (magenta) (E) and InSETG-4B (red) (F) in K562 cells exposed to etoposide (180 μM) for 24 h. The blue DAPI stain marks nuclei. The bacterial DapB gene was used as the negative control. InSETG-4 loci are indicated by white arrows. Scale bar: 5 μm

