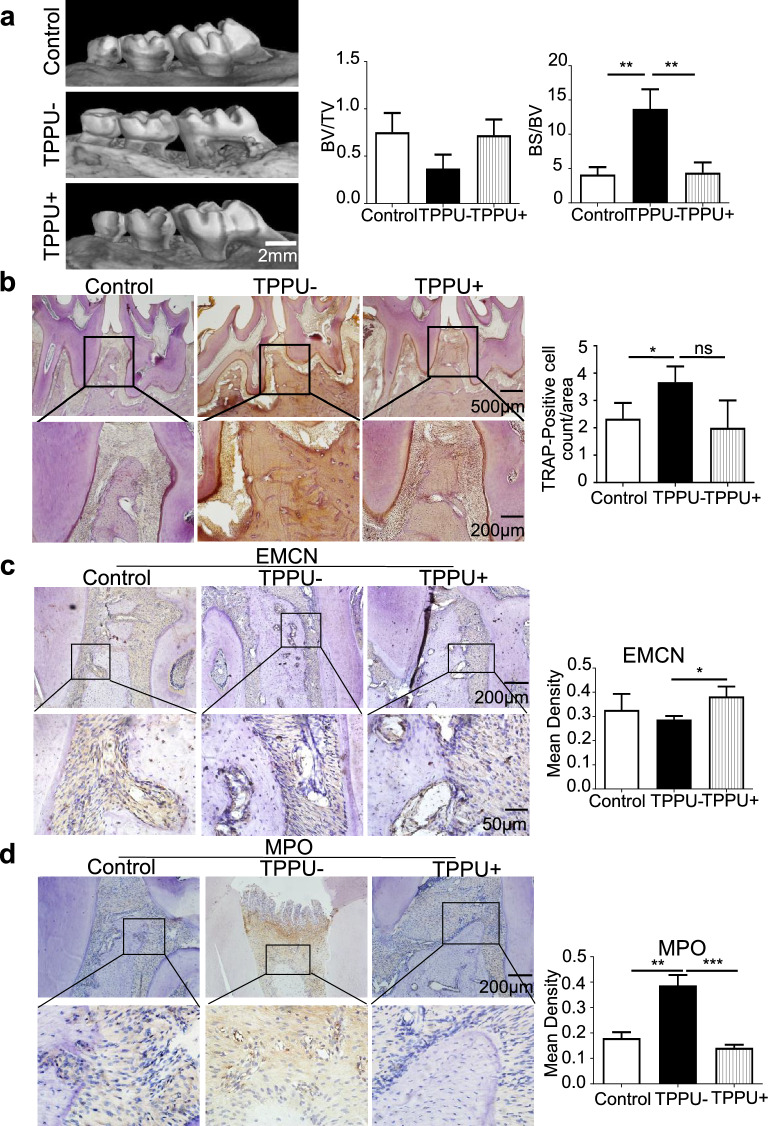
Fig. 6.
TPPU restrains inflammatory bone loss and osteoclastogenesis. a Representative micro-CT images and BV/TV (bone volume fraction) and BS/BV (bone surface area–bone volume ratio) analyses in the control, TPPU- and TPPU + groups; scale bar = 2 mm. b Representative image of TPAR staining and quantification of TRAP-positive cells in control, TPPU-, and TPPU + groups; scale bar = 500 μm (upper panel); scale bar = 200 μm (lower panel). c Representative image and quantitative analysis of immunohistochemical staining showing the expression of EMCN in control, TPPU-, and TPPU + groups; scale bar = 200 μm (upper panel); scale bar = 50 μm (lower panel). d Representative image and quantitative analysis of immunohistochemical staining showing MPO + cells in the control, TPPU-, and TPPU + groups; scale bar = 200 μm (upper panel); scale bar = 50 μm (lower panel). * P < 0.05, ** P < 0.01, *** P < 0.001

