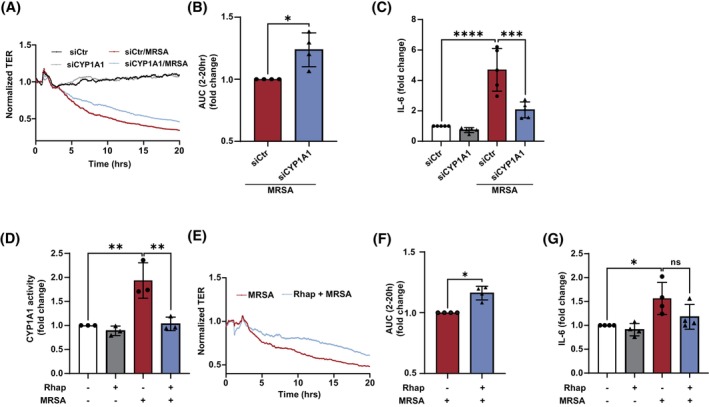
FIGURE 5.

CYP1A1 expression and activity mediate MRSA‐induced EC permeability and inflammatory responses. (A–C) HPAEC were transfected with CYP1A1 siRNA or control for 48 h before HK‐MRSA (2.5 × 10⁸/mL) treatment. EC barrier function was assessed using the ECIS assay. Normalized transendothelial electrical resistance (TER) values were monitored over time. (A) Representative TER tracing, and (B) quantification of the area under the curve during MRSA‐induced EC barrier disruption (higher levels indicate enhanced cumulative barrier function). (C) IL‐6 supernatant levels from MRSA‐treated EC (5 × 10⁸/mL, 6 h) after transfection with CYP1A1 siRNA or control. (D–F) EC were treated with the CYP1A1 inhibitor rhapontigenin (5 μM) or vehicle (DMSO) for 1 h before HK‐MRSA (2.5 × 10⁸/mL). (D) CYP1A1 activity as assessed using the EROD assay. (E, F) EC barrier function was assessed using ECIS. (E) Representative TER tracing, and (F) quantification of the area under the curve during MRSA‐induced EC barrier disruption. (G) IL‐6 levels in EC supernatants after indicated treatments (2.5 × 10⁸/mL, 6 h). N = 3–4 independent experiments. Data were analyzed using Welch's t‐test (B, F) or one‐way ANOVA (C, D, and G), *p < .05, **p < .01, ***p < .001, ****p < .0001.
