
FIGURE 8.
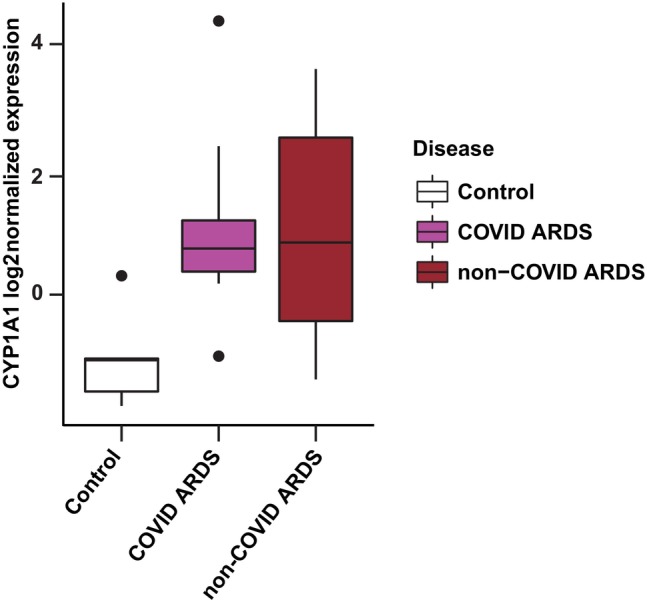
CYP1A1 expression in tracheal aspirates of ARDS patients. Box plot of CYP1A1 log2‐normalized expression in human patient tracheal aspirates derived from publicly available data. 37 The box represents the interquartile range (IQR), with the upper and lower borders indicating the 75th and 25th percentiles, respectively. Outliers are defined as data points exceeding 1.5 times the IQR beyond these percentiles and indicated by dots in the figure. Data were derived from patients undergoing mechanical ventilation with COVID ARDS (n = 15), non‐COVID ARDS (n = 32), and control patients without ARDS (n = 5). Both ARDS groups individually, as well as when combined for analysis, had increased CYP1A1 RNA levels compared to control patients (p < .01). This secondary analysis does not necessarily reflect the opinions and conclusions of the investigators who performed the original study that collected these data. 37