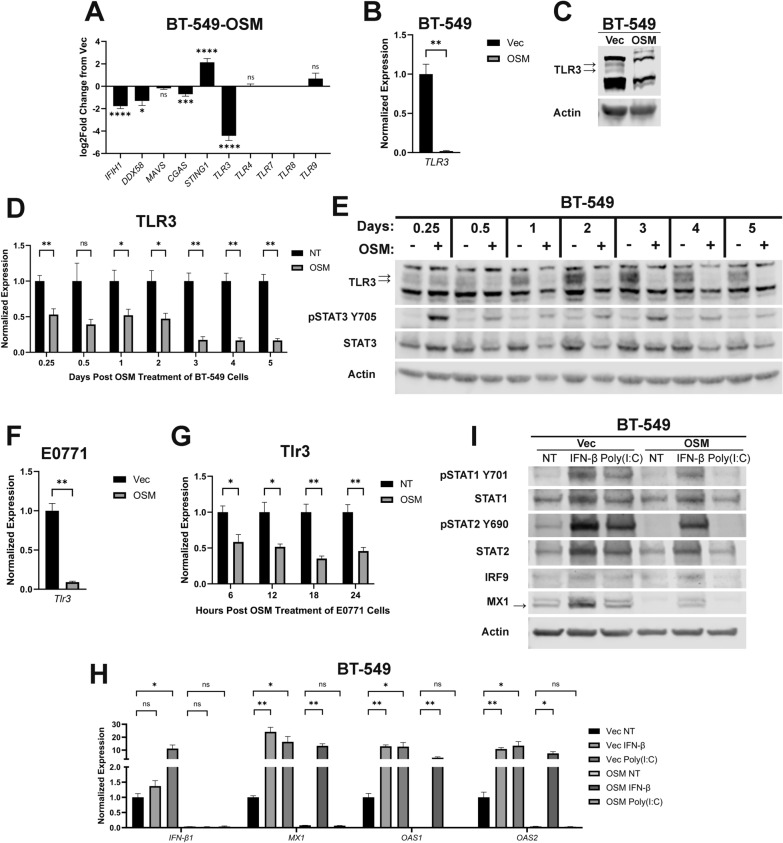
Fig. 2.
OSM-mediated repression of TLR3 suppresses IFN-β production and its autocrine signaling. A Pairwise comparisons of genes encoding the indicated innate immune sensors were made using RNA-sequencing data of BT-549-OSM and BT-549-Vec cells. Data represents mean fold changes ± SEM, n = 2. Statistical significance was determined via Wald tests where *p < 0.05, ***p < 0.001, and ****p < 0.0001. B qRT-PCR and C Western blot analyses of BT-549-OSM and BT-549-Vec cells assessing TLR3 expression. Data represents mean fold changes ± SEM, n = 4. Statistical significance was determined via Welch’s t-tests where **p < 0.01. D qRT-PCR and E Western blot analyses of TLR3 expression in BT-549 cells treated with recombinant OSM for the indicated time points. Cells undergoing no treatment (NT) were included as a negative control group for each time point. Data represents mean fold changes ± SEM, n = 4. Statistical significance was determined via Welch’s t-tests where *p < 0.05 and **p < 0.01. F qRT-PCR analysis of E0771-OSM and E0771-Vec cells assessing Tlr3 expression. Data represents mean fold changes ± SEM, n = 4. Statistical significance was determined via Welch’s t tests where **p < 0.01. G qRT-PCR analysis of Tlr3 expression in E0771 cells treated with recombinant OSM for the indicated time points. Data represents mean fold changes ± SEM, n = 4. Statistical significance was determined via Welch’s t-tests where *p < 0.05 and **p < 0.01. H qRT-PCR and I Western blot analyses of BT-549-OSM and BT-549-Vec cells treated for 6 h with either recombinant IFN-β or poly(I:C) assessing IFN-β1, ISGs, IFNARs, and ISGF3. Data represents mean fold changes ± SEM, n = 4. Statistical significance was determined via Welch’s t-tests where *p < 0.05 and **p < 0.01

