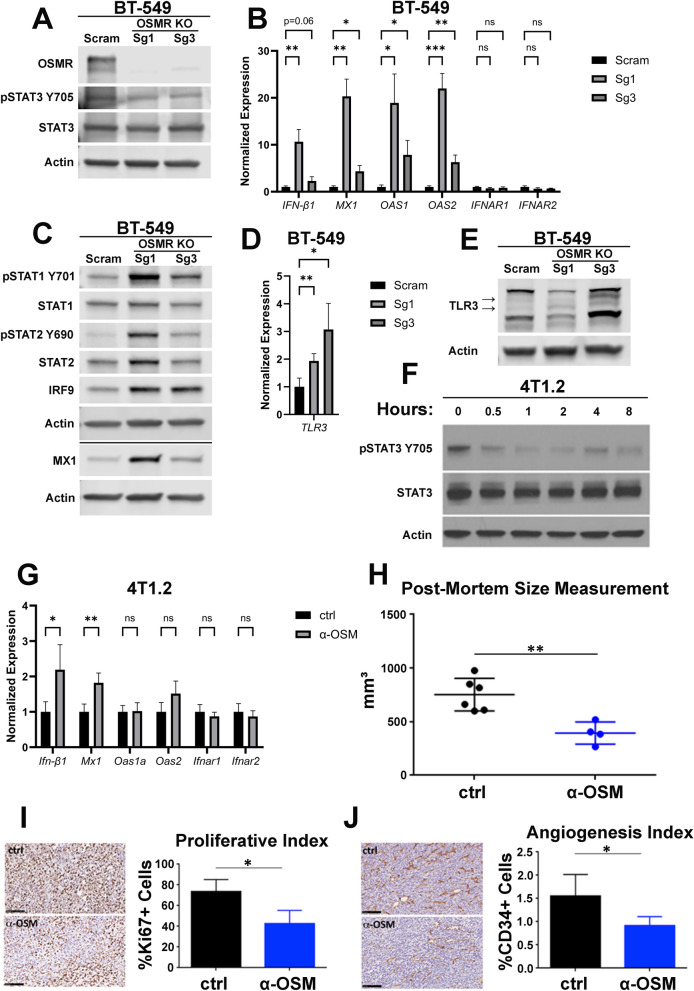
Fig. 3.
Endogenous OSM controls IFN-β production and tumor-initiating capacity. A BT-549 cells were infected with lentiviruses encoding small guide RNAs targeting OSMR or a scrambled (Scram) control. Following selection, cells were assessed by Western blot analysis for OSMR expression and STAT3 phosphorylation. B qRT-PCR and C Western blot analyses on BT-549-OSMR-KO and BT-549-Scram cells assessing IFN-β1, ISGs, IFNARs, and ISGF3. Data represents mean fold changes ± SEM, n = 4. Statistical significance was determined via Welch’s t-tests where *p < 0.05, **p < 0.01, and ***p < 0.01. D qRT-PCR and E Western blot analyses of BT-549-OSMR-KO and BT-549-Scram cells assessing TLR3 expression. Data represents mean fold changes ± SEM, n = 4. Statistical significance was determined via Welch’s t-tests where *p < 0.05 and **p < 0.01. F 4T1.2 cells were treated with an OSM-neutralizing antibody for the indicated time points. STAT3 phosphorylation was assessed via Western blot analysis. G qRT-PCR of 4T1.2 cells were treated with either an OSM-neutralizing antibody (α-OSM) or an isotype control (ctrl) for 24 h. Data represents mean fold changes ± SEM, n = 4. Statistical significance was determined via Welch’s t-tests where *p < 0.05 and **p < 0.01. Comparison of size, H Ki67 staining, I and CD34 staining J of 4T1.2-derived tumors subcutaneously injected into BALB/c mice treated with either an OSM-neutralizing antibody or an isotype control (ctrl). Data represents mean fold changes ± SEM, n ≥ 4. Statistical significance was determined via Welch’s t-tests where *p < 0.05 and **p < 0.01

