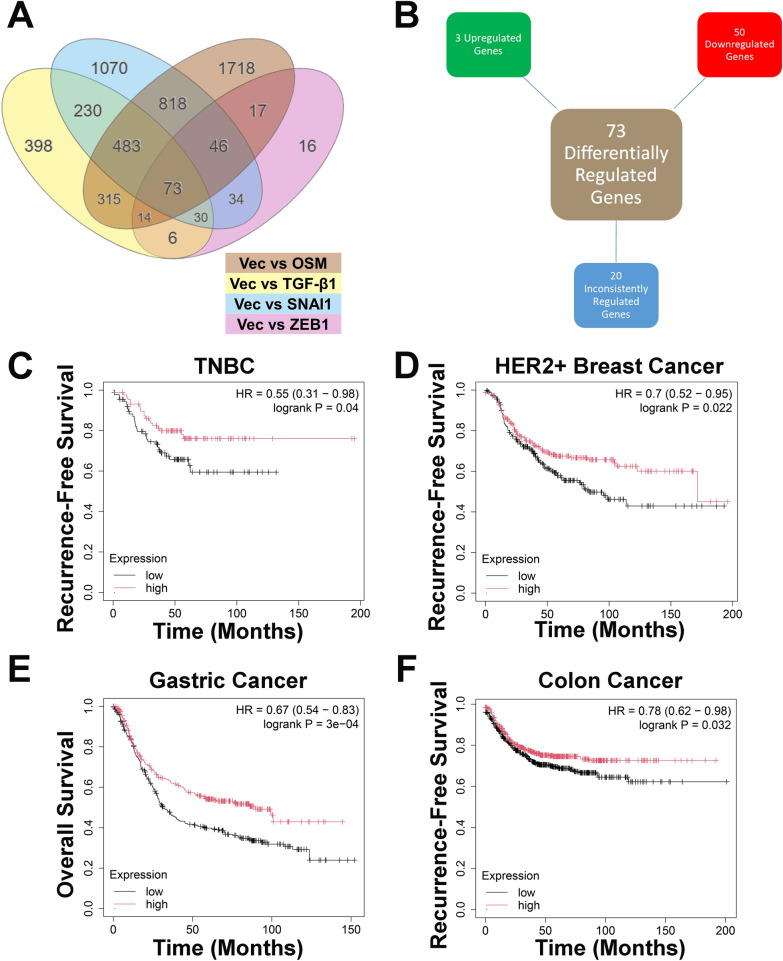
Fig. 6.
A novel interferon gene signature correlates with patient prognosis. A RNA-sequencing data was analyzed to identify common differentially expressed genes between BT-549-OSM, BT-549-TGF-β1, BT-549-SNAI1, and BT-549-ZEB1 cells relative to BT-549-Vec cells. Only genes with p values < 0.05, as determined by the DESeq2 package in R, were included. B Differentially regulated genes in BT-549-OSM, BT-549-TGF-β1, BT-549-SNAI1, and BT-549-ZEB1 cells compared to BT-549-Vec cells are organized into 3 categories: consistently upregulated in each group, consistently downregulated in each group, or inconsistently regulated between groups compared to BT-549-Vec cells. C Kaplan–Meier plot of patients with TNBC, D HER2 + breast cancer, E gastric cancer, and F colon cancer that express high or low levels of the 50 repressed genes from A using the median as the cutoff value for expression

