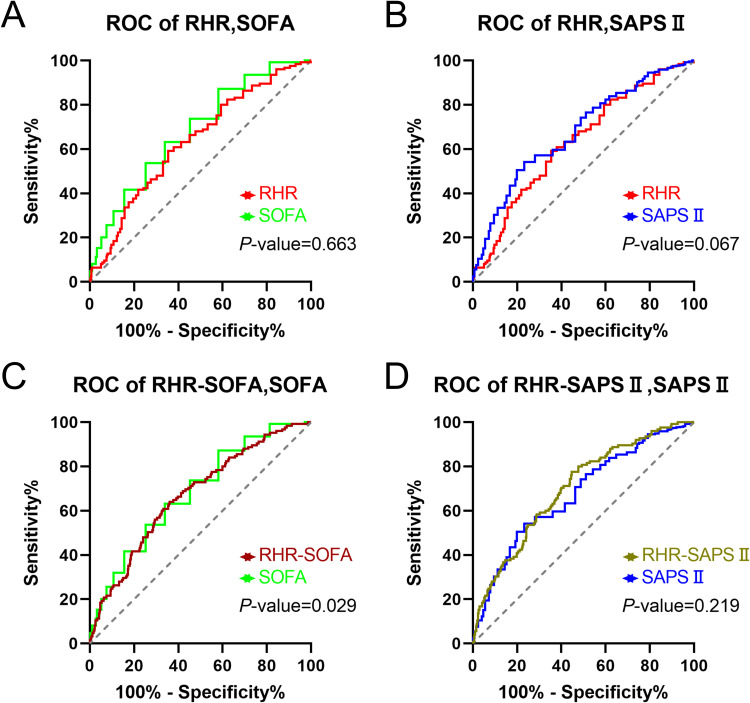
Figure 3.
Receiver operating characteristic (ROC) curves for RHR, SOFA, SAPSII, RHR-SOFA and RHR-SAPSII in both the survival and non-survival groups, accompanied by the p-value indicating the difference between the ROC curves. (A): ROC curves for RHR and SOFA. (B): ROC curves for RHR and SAPSII. (C): ROC curves for combined RHR-SOFA and SOFA alone. (D): ROC curves for combined RHR-SAPSII and SAPSII alone.

