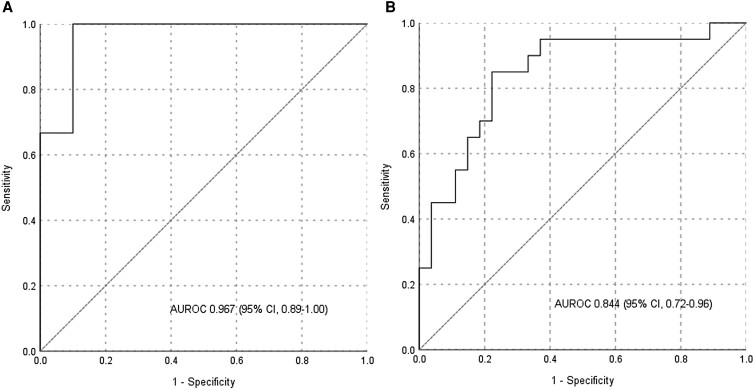
Figure 2.
(A) ROC curve for arterial attenuation in good washout pheochromocytomas (relative percentage washout ≥40%) compared with other masses; (B) ROC curve for arterial attenuation in poor washout pheochromocytomas (relative percentage washout <40%) compared with other masses.
Abbreviations: AUROC, area under the receiver operating characteristic curve; CI, confidence interval; ROC, receiver operating characteristic.

