Figure 3.
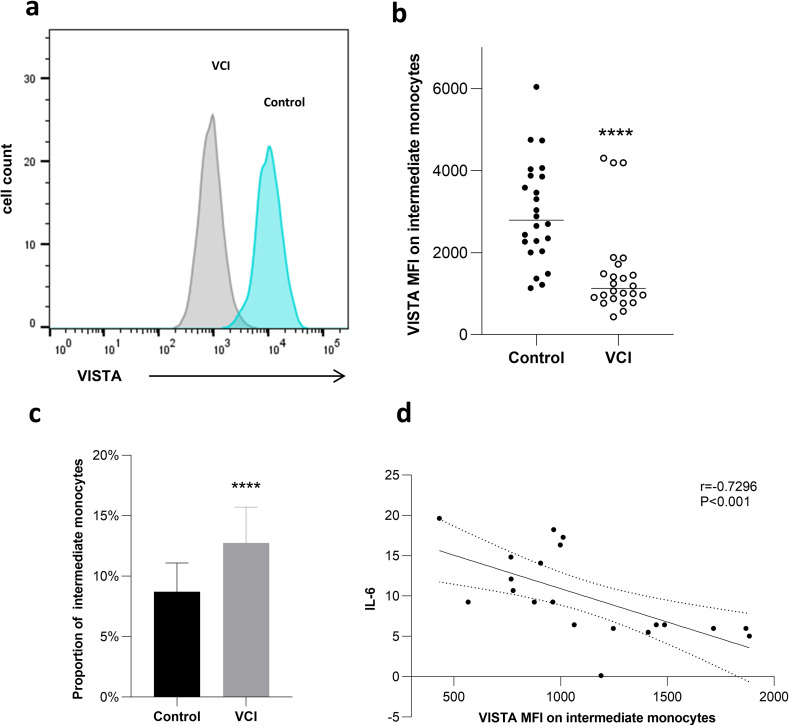
Vista expression in intermediate monocytes.
Notes: A representative histogram (a) and cumulative data (b) of VISTA expression on CD14brightCD16+ gated cells from control and VCI groups. MFI, mean fluorescence intensity. ****indicates p<0.0001. (c) Comparison of proportion of intermediate monocytes between 2 patient groups.**** indicates p<0.0001. (d) The level of IL-6 has a significant negative correlation with the VISTA MFI on intermediate monocytes of VCI patients.

