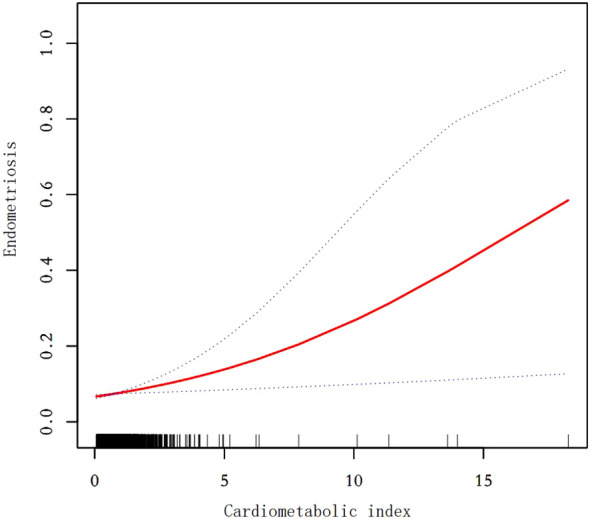
Figure 2.

Smooth curve fit between cardiometabolic index and endometriosis. The solid red line represents the smooth curve fit between variables. Blue bands represent the 95% confidence interval from the fit. After adjusting for age,ethnicity,PIR,drinking,smoking,education level,marital status,hysterectomy, the relationship between cardiometabolic index and endometriosis was analyzed by smooth curve fitting.
