. 2024 Nov 21;12(11):e009888. doi: 10.1136/jitc-2024-009888

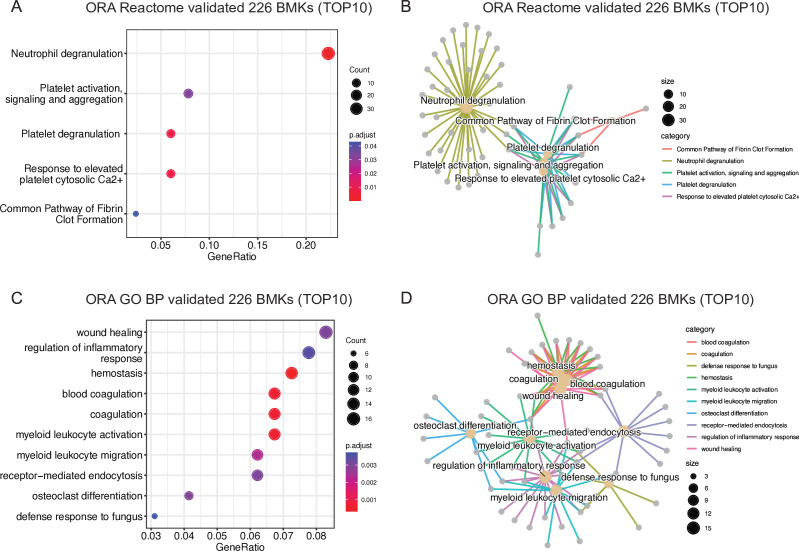
Figure 3. Wound healing and myeloid cell activation pathways are triggered in blood of CRC patients. (A) Over-representation analysis (ORA) results of validated 226 CRC BMKs using Reactome, adjusted p value<0.05, q value<0.05 and Benjamini-Hochberg correction method. (B) Network showing the relationship between the enriched Reactome pathways and genes found among validated 226 CRC BMKs. (C) Top10 enriched Gene Ontology (GO) biological process (BP) among validated 226 CRC BMKs. A p value cut-off of 0.05 and q value cut off-of 0.05 were used followed by a simplification step by padj with a 0.7 cut-off. (D) Network showing the relationship between the enriched GO BP pathways and genes found among validated 226 CRC BMKs. In panels A and C, the X-axis represents the ratio between the number of genes that are part of the BP indicated in the Y-axis and the total BMK list. The size of the dots represents the number of genes from the BMKs that are found in each BP and the color represents the significance of the enrichment per biological pathway. CRC, colorectal cancer; BMK, biomarker.

Figure 3