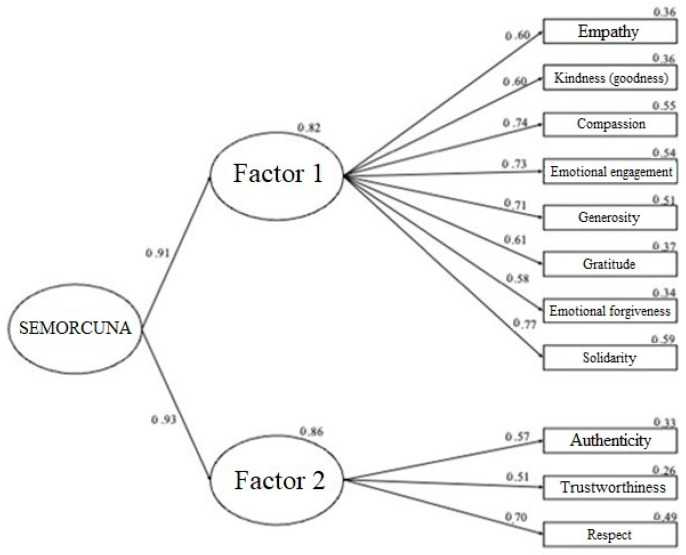
Figure 2.
CFA of the bifactorial model for the complete sample. Note: Graphical representation of the model, with standardized factor loading estimates. The errors associated with the items have not been included in the representation for clarity of the model. All lines indicate significant relationships at a level of p < 0.001.

