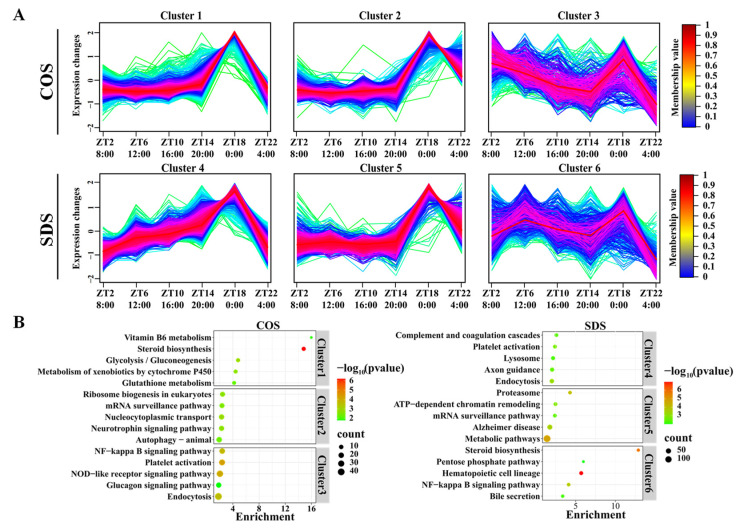
Figure 3.
Sleep deprivation alters the diurnal pattern of rumen metabolites in Tibetan sheep. (A) Identification of distinct temporal patterns of expression genes in the COS and SDS groups by fuzzy c-means clustering. The y-axis represents normalized data based on all expression genes within each cluster. (B) KEGG analysis (p < 0.05) of the metabolites within each cluster in the COS and SDS groups.

