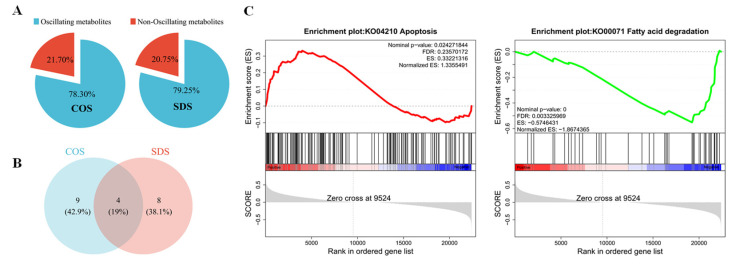
Figure 4.
Sleep deprivation alters the circadian rhythm of the liver in Tibetan sheep. (A) Pie chart diagram showing the percentage of oscillating and non-oscillating DEGs in the COS and SDS groups (ADJ.P < 0.05). (B) Vene diagram displaying the number (top) and ratio (bottom) of oscillating DEGs in liver samples isolated from Tibetan sheep in the COS and SDS groups (ADJ.P < 0.05). (C) The lipid metabolism and apoptosis-related pathways derived from the GSEA analysis of the liver gene profiling (|NES| > 1, NOM p-val < 0.05, FDR q-val < 0.25). The red line indicates high expression in the SDS group, and the green line indicates high expression in the COS group.

