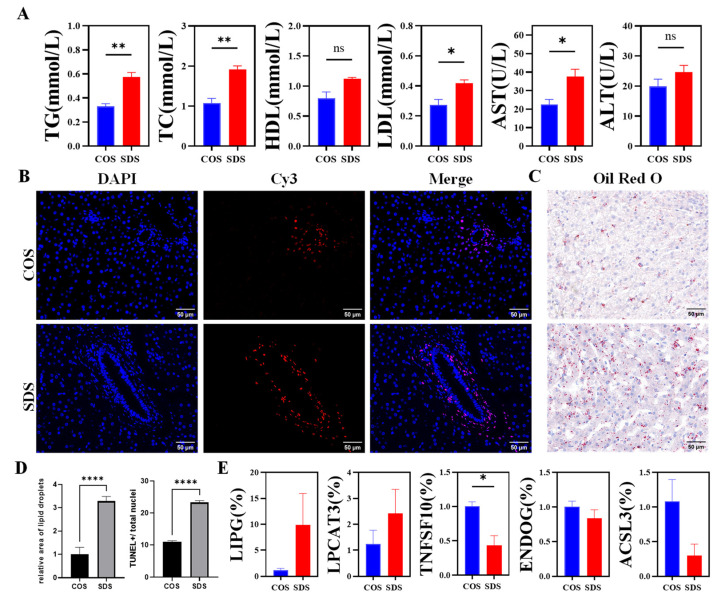
Figure 5.
Sleep deprivation impacts lipid metabolism and induces hepatic injury. (A) Serum TG, TC, HDL, LDL, AST, and ALT levels. (B) TUNEL assay of liver tissue cells. Nuclei stained by Merge. Positive apoptotic cells are red. Blue is the nucleus. Scale bars, 50 μm. Magnification: ×40. (C) Representative images of liver sections stained with Oil red O. Scale bars, 50 μm. Magnification: ×40. (D) Quantitative data for the percentage of TUNEL-positive cells and the positive area of the Oil red O staining in the COS and SDS groups. (E). mRNA expression of LIPG, TNFSF10, LPCAT3, ENDOG, and ACSLE in the liver. All data are shown as the mean ± SEM. * p < 0.05, ** p < 0.01, **** p < 0.0001.

