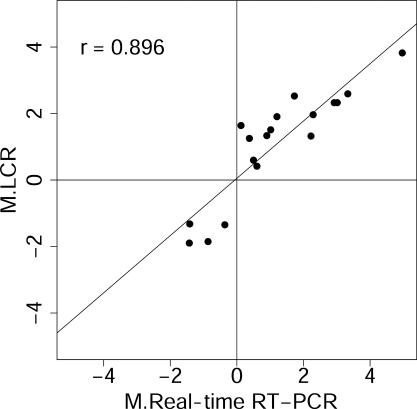
Figure 2.
LCR targets can detect differential gene regulation. LCR pm22 target was prepared from RNA from serum-starved and starved-refed fibroblasts 4 h after refeeding, and analyzed using microarrays. Differentially regulated genes detected by the LCR were quantified using real-time RT–PCR. This figure shows that the log2 ratios (M) of transcripts from the two methods correlate well and confirms that LCRs reliably report differential transcript abundance. Axis label ‘M.LCR’ is the average log2 ratio of the normalized channel intensities, I, for the 4 and 0 h treatments, i.e. M.LCR = log2(It=4/It=0), reported by the LCR target, and ‘M.Real-time RT–PCR’ is the log2 of the corresponding ratio reported by real-time RT–PCR. Pearson's correlation, r, is shown.

