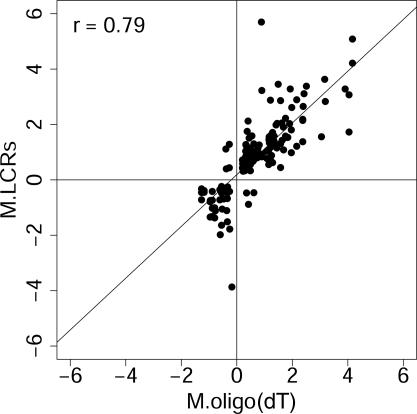
Figure 5.
LCR targets and oligo(dT)-primed targets report similar changes where overlap occurs. LCR targets and oligo(dT) targets report similar log ratios of differential expression, in those cases where both methods detect a change. This graph shows differential gene expression discovered using microarrays and oligo(dT) priming for target synthesis, compared with the corresponding measurement from the LCRs. Only those genes detected as changed with P ≤ 0.05 in an LCR are included. Axis label ‘M.LCRs’ is the average log2 ratio of the normalized channel intensities, I, for the 1 and 0 h treatments, i.e. M.LCRs = log2(It=1/It=0), and ‘M.oligo dT’ is the log2 of the ratio for the same gene reported by the oligo(dT) targets. Pearson's correlation, r, is shown.

