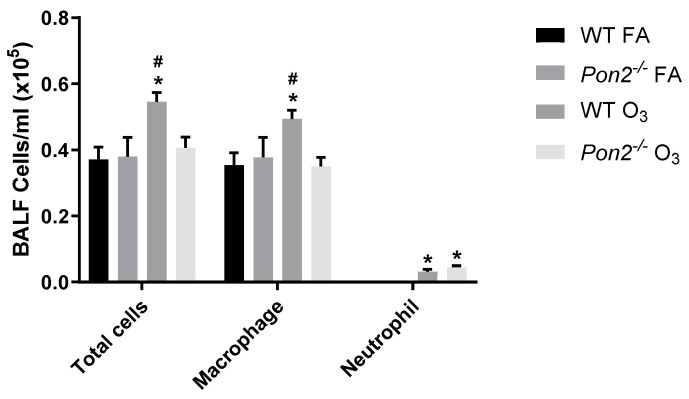
Figure 3.
Total and differential cell counts in BAL fluid measured in Pon2−/− and WT mice 24 h following exposure to filtered air (FA) or 2 ppb ozone (O3). Cell counts were measured using a K2 Cellometer. Differential cell counts were performed by manual count on a single 40x image of a cytospin slide. N = 13 for WT FA; N = 5 for Pon2−/− FA; N = 18 for WT O3; and N = 12 for Pon2−/− O3. Data presented as mean ± standard deviation. Comparison made by 2-way ANOVA. * p < 0.05 compared to FA. # p < 0.05 compared to the other genotype.

