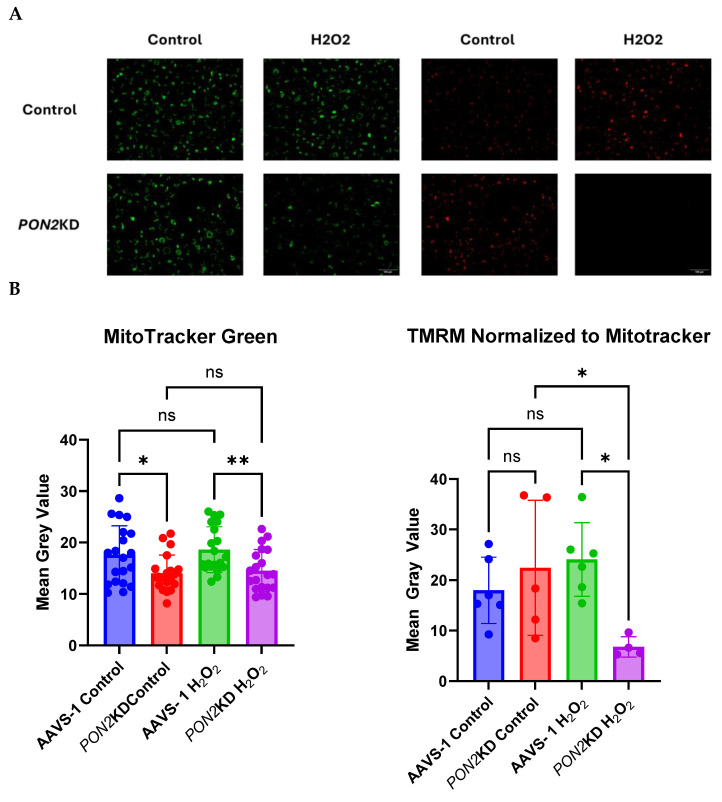
Figure 7.
Mitochondrial function and mass in AAVS-1 and PON2KD cells. Cells were exposed to 100 µM H2O2 for 24 h. ΔΨm. PON2KD and AAVS-1 control BEAS-2b cells were grown to 70% confluence and stained with (A) MitoTracker Green (Left) and TMRM (Right) and imaged at 40x magnification. (B) Fluorescence intensity of Mitotracker Green (Right) and TMRM normalized to Mitotracker Green (Left). We observed a decrease in total mitochondrial mass in PON2KD cells compared to AAVS-1 control that does not change with H2O2 exposure. However, a decline in relative TMRM expression following H2O2 exposure in PON2KD cells compared to controls was noted, indicating a decrease in ΔΨ. Data presented as mean ± standard deviation. Comparisons made by 2-way ANOVA. ns = not significant, * p < 0.05, ** p < 0.01.

