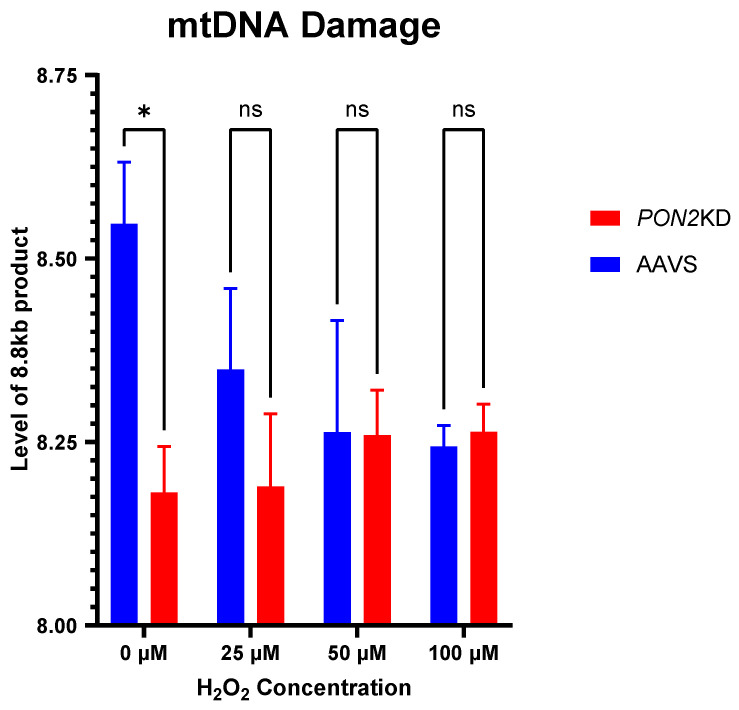
Figure 8.
Mitochondrial DNA Lesions. BEAS-2b cells were exposed to 0, 25, 50, or 100 µM of H2O2 for 24 h. mtDNA lesions were measured by amplification of an 8.8 kB fragment and subsequent quantification by RT-PCR. N = 3/group. Data are depicted as means ± standard deviations. Comparisons made with multiple paired t-tests ns = not significant * p < 0.05.

