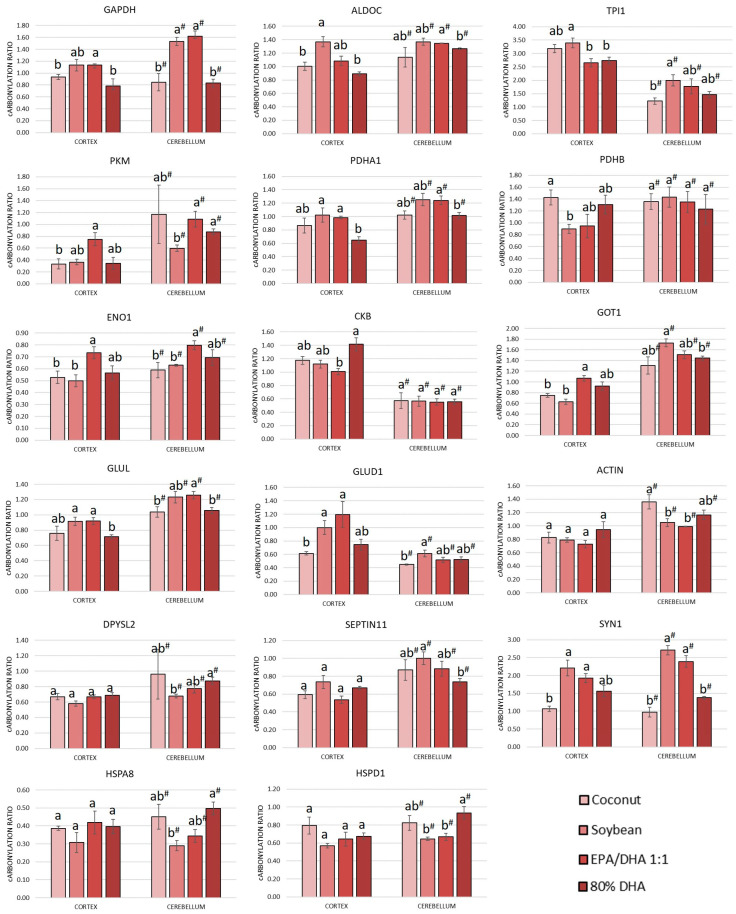
Figure 2.
Carbonylated proteins modulated by supplementation of a diet with oils at increasing degree of fatty acid unsaturation and found carbonylated in both the cortex and the cerebellum of 8-month-old Sprague Dawley rats. Bars represent means ± standard deviations (n = 10). One-way ANOVA analyses were conducted. Post hoc Tukey HSD analyses were performed following ANOVA to assess mean differences between groups. Means with the same superscript letter (a, b in the cortex and a#, b# in the cerebellum) are not significantly different from each other, while means with different letters indicate significant differences, according to Tukey’s post hoc test (p < 0.05). Protein abbreviations are outlined in Table 4.

