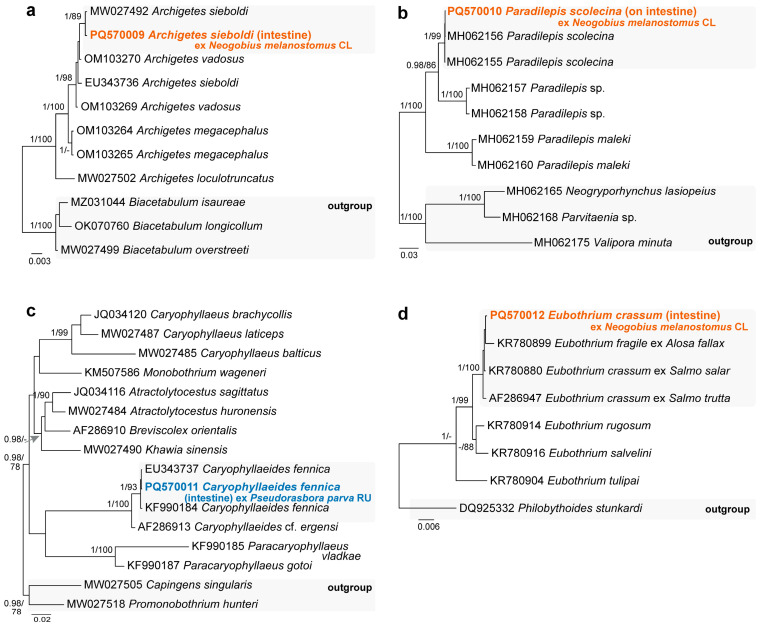
Figure 3.
Phylograms resulting from Bayesian inference (BI) analyses based on the 28S rDNA sequences of (a) Archigetes spp., (b) Paradilepis spp., (c) representatives of the Lytocestidae, and (d) Eubothrium spp. with nodal support values shown at the node as BI/ML (maximum likelihood). Only values > 0.90 (BI) and >70 (ML) are displayed. Scale bar indicates the expected number of substitutions per site. Sequences generated in this study are in bold and the colour corresponds to the colour of their fish host (see Figure 1, Table 1 for abbreviations).

