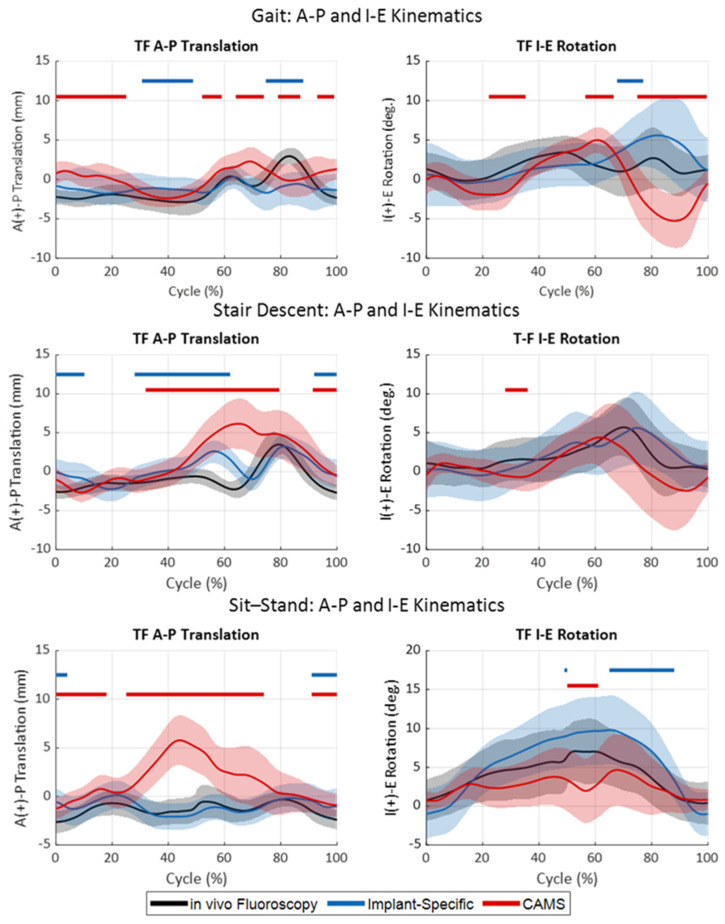
Figure 6.
TF kinematics during gait (top), stair descent (middle), and sit–stand (bottom) activities. In vivo kinematics (black) were compared to the kinematics of the cadaveric specimen using either the implant-specific boundary condition (blue) or CAMS-Knee boundary conditions (red). Shaded regions indicated one standard deviation. Horizontal bars indicate regions of significant difference between the in vivo kinematics and the two sets of cadaveric kinematics.

