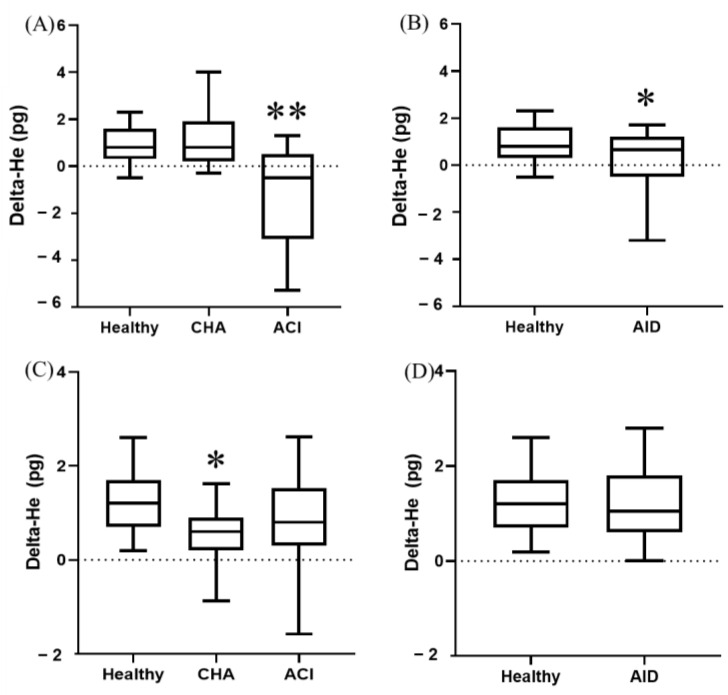
Figure 2.
Delta-He in different groups of dogs (A,B) and cats (C,D). Box and whisker plot. The first and third quartiles form the limits of the box, with the internal line representing the median value. Whiskers correspond to the 10–90% percentile. ACI, anemia of chronic inflammation; AID, acute inflammatory disease; CHA, chronic hemorrhagic anemia. * p < 0.05 vs. healthy. ** p < 0.05 vs. every other group.

