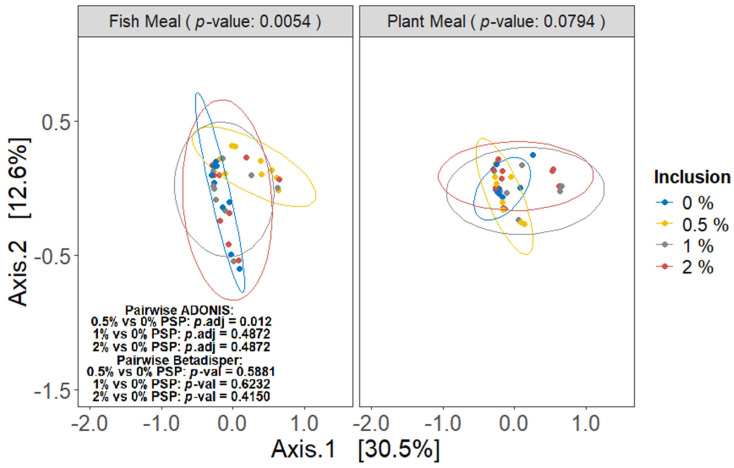
Figure 5.
Beta diversity of gut microbiota as influenced by different dietary protein sources and levels of pistachio shell powder (PSP) inclusion, assessed using Bray–Curtis dissimilarity metrics with ADONIS test. The analysis is presented in two principal coordinate analysis (PCoA) plots, one for fishmeal (left) and one for plant meal (right). Individual-sample beta diversity is represented by points, colored according to the dietary PSP inclusion level (0%, 0.5%, 1%, or 2%) being received by that individual.

