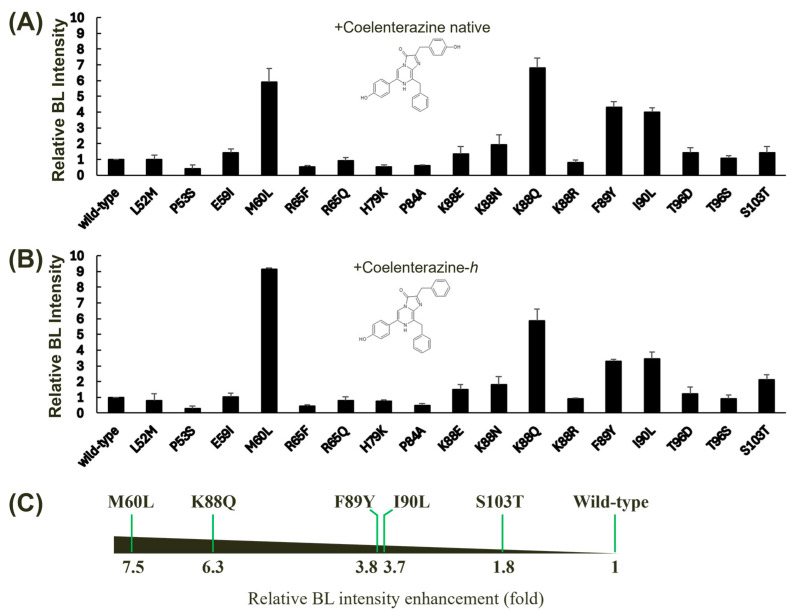
Figure 3.
Effect of single mutagenesis on the BL activity of GLuc. Single mutants were derived from wild-type GLuc via site-directed mutagenesis, and their BL intensities were assessed using two different substrates: coelenterazine native (A) and coelenterazine-h (B). The BL intensity of GLuc was measured at 482 nm. Error bars represent the standard deviations from three independent experiments. (C) A horizontal bar chart summarizing the relative BL intensity enhancement (fold increase) for selected mutants compared to the wild type is shown. The fold increase was calculated by taking the average of the values in (A,B). The mutants exhibiting significant increases in BL intensity are displayed.

