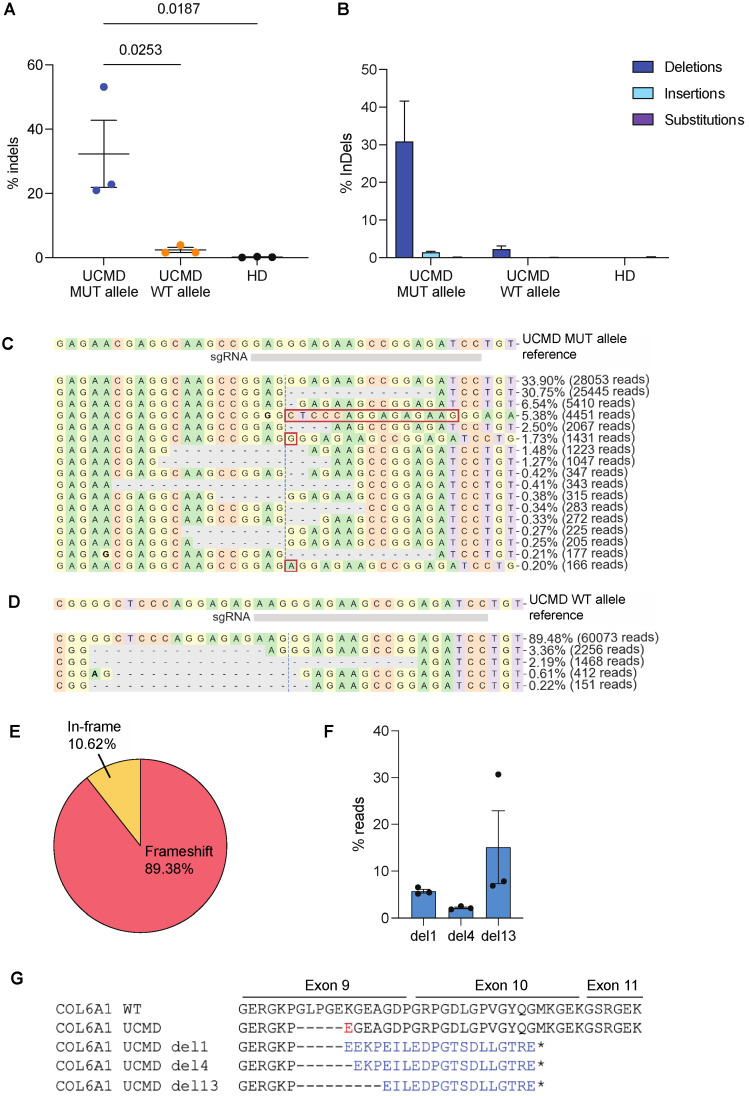
Figure 2.
NGS data analysis of UCMD patient cells electroporated with RNP/gRNA3. (A) Frequency of indels in exon 9 of WT or mutant allele (MUT) from UCMD fibroblasts or from HD fibroblasts. The experiment was performed in triplicate and is presented as mean ± SEM. * p < 0.05. (B) Type of indels, and their relative percentage, generated in WT or mutant allele (MUT) from UCMD fibroblasts or from HD fibroblasts. (C,D) CRISPResso2 graphic representation of the distribution of identified alleles around the cleavage site of the gRNA3 on UCMD mutated allele or on WT allele. The top sequence is the unmodified reference. Substitutions are shown in bold font. Red rectangles highlight inserted sequences. Horizontal dashed lines indicate deleted sequences. The vertical dashed line indicates the predicted cleavage site. A representative experiment is shown. (E) CRISPResso2 analysis of indels generated on UCMD MUT allele leading to frameshift or in-frame mutations. The mean of triplicates is presented in pie chart. (F) Percentages of the three most frequent mutants (del1, del4, del13) identified by CRISPResso2 upon editing the MUT allele of UCMD fibroblasts. (G) Amino acid sequence of exon 9-11 in COL6A1 WT, UCMD c.824_838del variant diagnosed in patient cells and UCMD variants (del1, del4 and del13) identified by CRISPResso2 upon editing the MUT allele of UCMD fibroblasts. The amino acid substitution resulted from the 15-nt deletion in UCMD MUT allele is highlighted in red, while different amino acid sequences resulting from CRISPR-induced frameshift are in blue. Dash indicates deleted codons, and star indicates premature stop codon downstream the canonical one.

