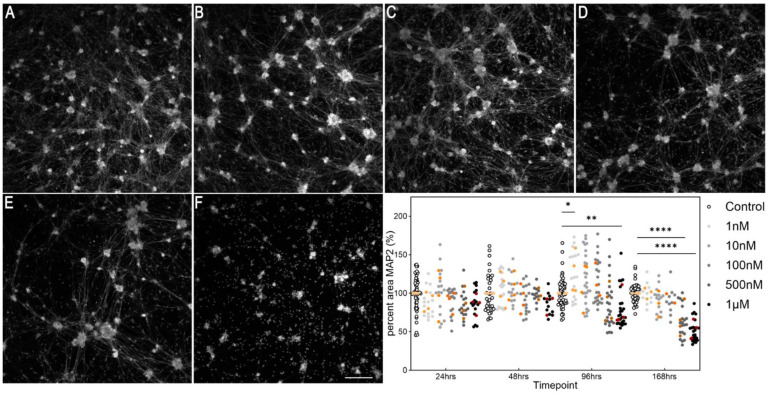
Figure 2.
Time-dependent cytotoxicity of rotenone in DRGs. Cells were fixed and stained for MAP2, a pan-neuronal marker. (A–F) Example photomicrographs following 7 days (168 h) of treatment; (A) = control, (B) = 1 nM, (C) = 10 nM, (D) = 100 nM, (E) = 500 nM, (F) = 1 µM. Scale bar in (F) = 200 µm and is for all photomicrographs. Photomicrographs are not edited except for contrast, and they depict the MAP2 channel. The graph shows the time-dependent effect of rotenone on DRGs. Symbols in white and shades of grey to black show data from individual technical replicates. Symbols in shades of orange to brown show experimental means. * p < 0.05, ** p < 0.01, **** p < 0.0001.

