Figure 7.
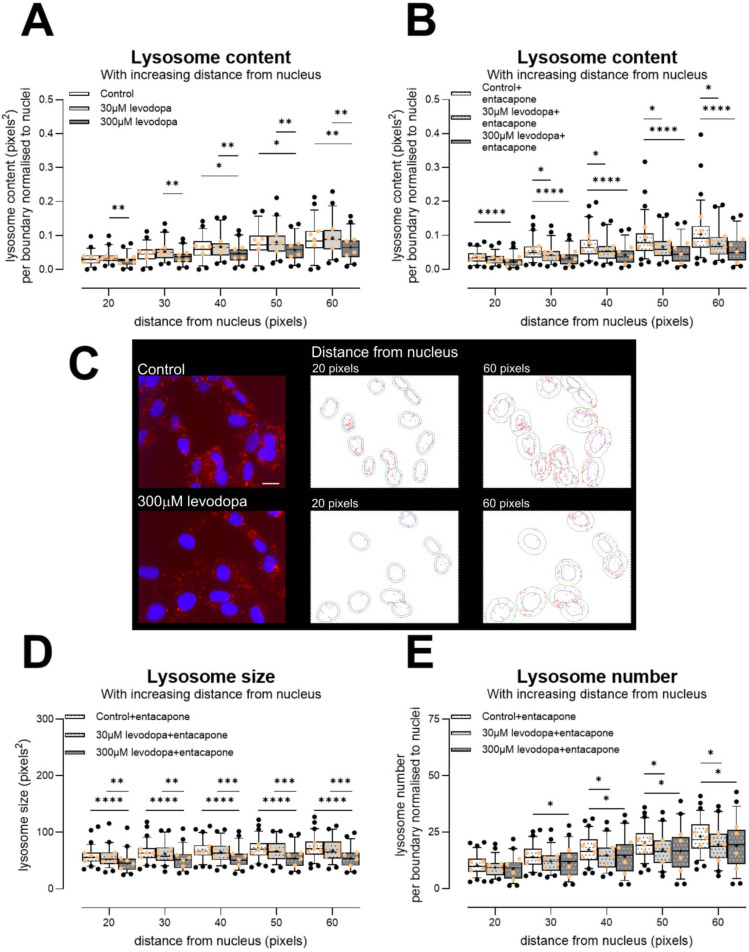
Effect of levodopa on lysosomes in the 50B11 immortalised sensory cell line, treated and incubated in hypoxia for 24 h. (A) A dose of 300 µM levodopa reduced lysosome content in comparison to control-treated cells and cells treated with 30 µM levodopa. (B) Both 30 µM and 300 µM levodopa reduced lysosome content when cells are treated with entacapone. (C) Photomicrographs show example images of cells treated with 0 µM or 300 µM levodopa for 24 h in hypoxia and labelled with Lysotracker (red) and Hoechst (nuclei). Photomicrographs are not modified except for brightness and contrast. Scale bar = 20 µm, for both photomicrographs. Outlines show examples of CellProfiler segmentations of lysosomes (red) at 20 pixels and 60 pixels from individual nuclei (blue). Note: For segmentation, the entire nucleus was required to be within the field of view, and not to touch the image border. The green lines show the appropriate boundaries. (D) Individual lysosome size per boundary, showing that in the context of entacapone, 300 µM levodopa in particular reduces lysosome size. (E) Number of lysosomes per boundary. In the context of entacapone, both 30 µM and 300 µM levodopa reduce lysosome number. Data in graphs are shown as box plots with whiskers depicting 5–95% percentiles, black circles depicting remaining data points, lines depicting medians and “+” symbols depicting means. * p < 0.05, **p < 0.01, ***p < 0.001, ****p < 0.0001. Light orange circles show experiment means. Entacapone = 1 µM [38].

